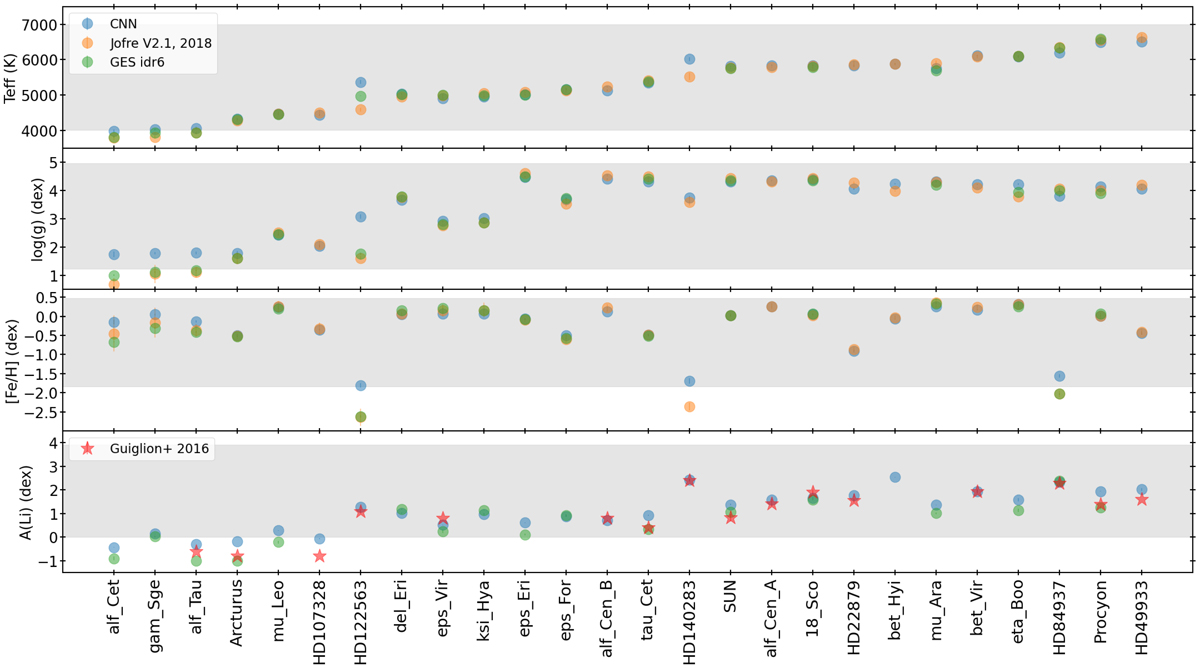
Fig. 17.
Download original image
Comparison of CNN prediction for the Gaia Benchmarks Stars (GBS). The reference Teff, log(g), and [Fe/H] come from Jofré et al. (2018) and A(Li) from Guiglion et al. (2016). The GES-iDR6 values are also shown for comparison. On the x-axis, we present the GBS names sorted by increasing Teff and on the y-axis, we present the four labels. The shaded region for each label represents the training set limits. The CNN predictions and error bars are mean of the estimates for the multiple spectra. CNN error bars are too small to be seen.
Current usage metrics show cumulative count of Article Views (full-text article views including HTML views, PDF and ePub downloads, according to the available data) and Abstracts Views on Vision4Press platform.
Data correspond to usage on the plateform after 2015. The current usage metrics is available 48-96 hours after online publication and is updated daily on week days.
Initial download of the metrics may take a while.