Fig. 16.
Download original image
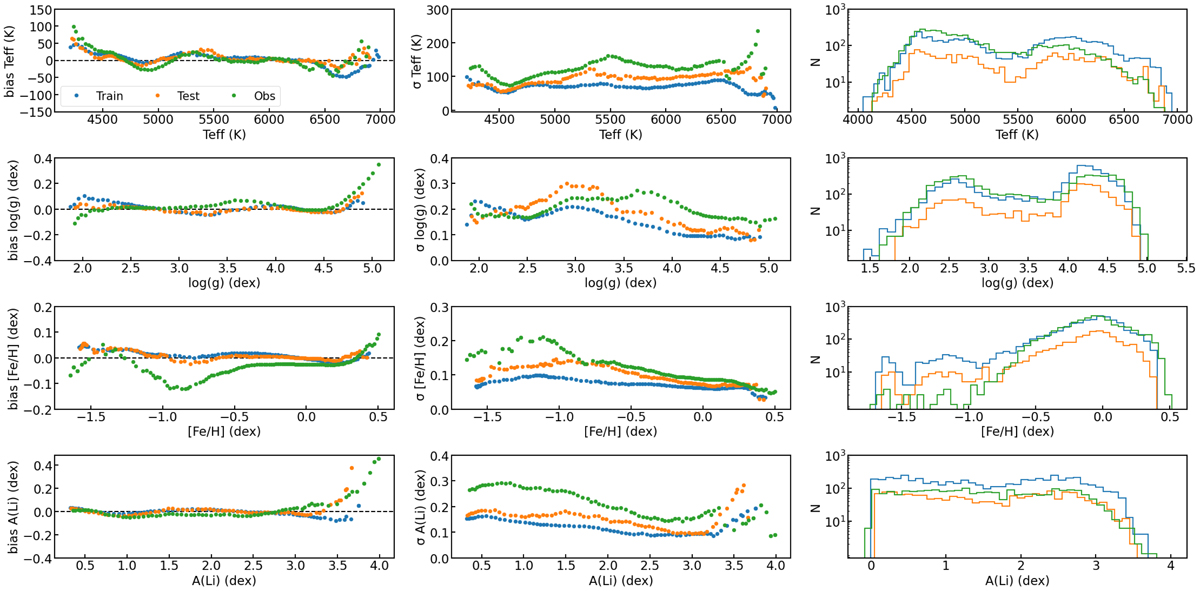
Running mean bias and mean dispersion as a function of labels for the train (blue), test (orange), and observed (green) sets calculated in bin sizes: 250 K for Teff, 0.3 dex for log(g), [Fe/H], and A(Li). The curves are representative of the real accuracy and precision of our CNN predictions. Bias = mean(CNN-iDR6) and σ = std(CNN-iDR6) for each bin. On the right column we present the distribution of the train, test and observed sets in logarithmic y-axis. The observed sample is selected within the training set, with S/N > 20 pix−1 and no GES flags; for A(Li), we selected only stars with Li measurements, instead of those with upper limit Li estimates.
Current usage metrics show cumulative count of Article Views (full-text article views including HTML views, PDF and ePub downloads, according to the available data) and Abstracts Views on Vision4Press platform.
Data correspond to usage on the plateform after 2015. The current usage metrics is available 48-96 hours after online publication and is updated daily on week days.
Initial download of the metrics may take a while.