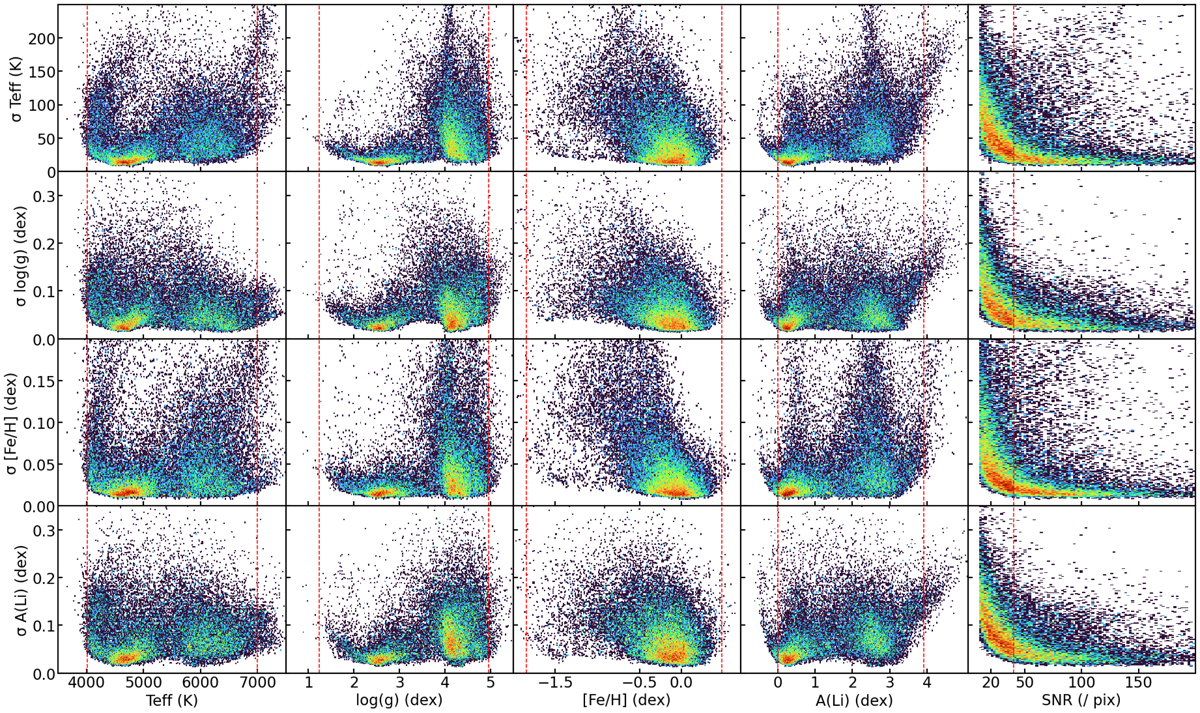
Fig. 15.
Download original image
2D histograms showing CNN uncertainties (internal precision) as a function of four labels (Teff, log(g), [Fe/H], A(Li)) and S/N for the observed sample with S/N > 10 pix−1, i.e., 31 272 spectra. The red dashed line shows the limits of the training labels. The x-axis represents the labels and the y-axis shows the uncertainty (σ).
Current usage metrics show cumulative count of Article Views (full-text article views including HTML views, PDF and ePub downloads, according to the available data) and Abstracts Views on Vision4Press platform.
Data correspond to usage on the plateform after 2015. The current usage metrics is available 48-96 hours after online publication and is updated daily on week days.
Initial download of the metrics may take a while.