Fig. 11.
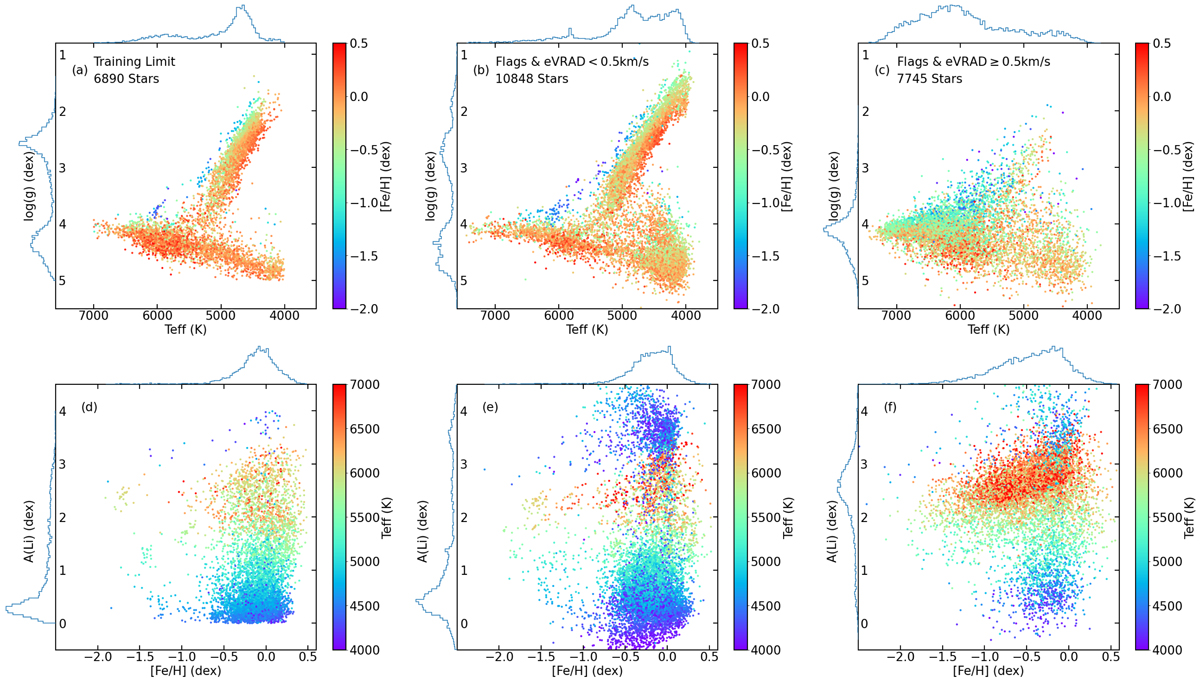
Download original image
Results for the observed sample. Top row: Kiel diagram for the observed sample stars with S/N > 10 dex and labels within training limits color-coded with [Fe/H]. (b) Same plot as (a) but for stars with S/N > 10 pix, GES-iDR6 flags and E_VRAD < 0.5 km s−1. (c) Same selection as (b) but for E_VRAD ≥ 0.5 km s−1. Each subplot shows a histogram of the labels on the left and top axis. Bottom row: A(Li) vs. [Fe/H] color-coded with Teff for the same stars as the Kiel diagram on top.
Current usage metrics show cumulative count of Article Views (full-text article views including HTML views, PDF and ePub downloads, according to the available data) and Abstracts Views on Vision4Press platform.
Data correspond to usage on the plateform after 2015. The current usage metrics is available 48-96 hours after online publication and is updated daily on week days.
Initial download of the metrics may take a while.