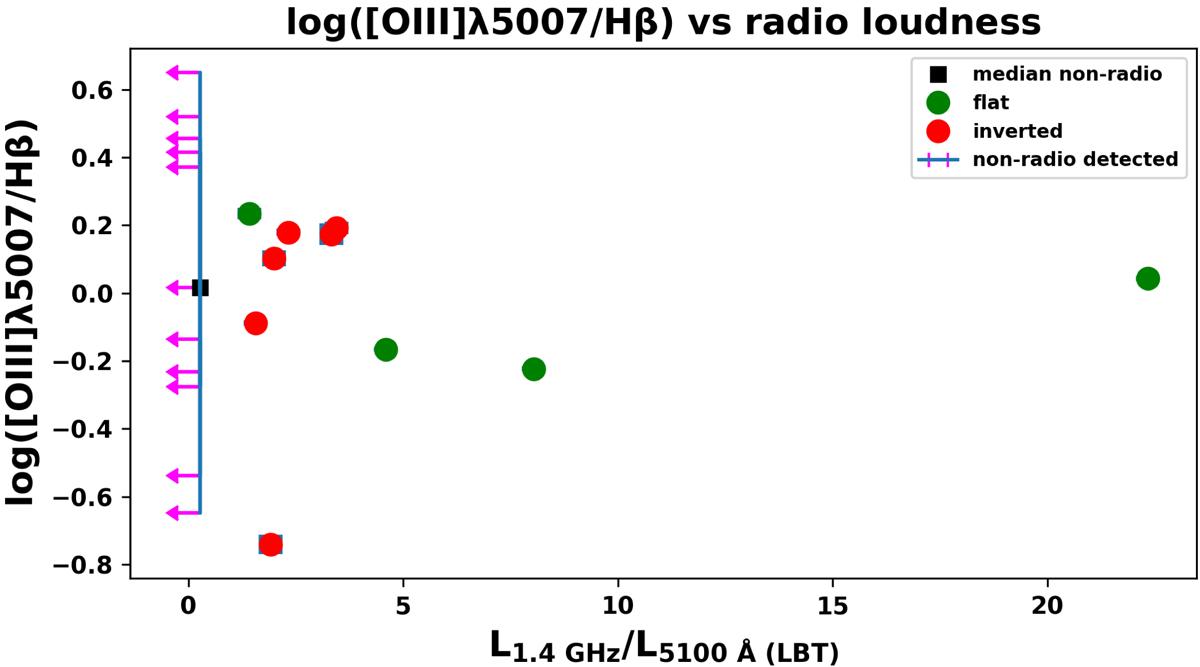
Fig. 9.
Download original image
Plot of log([O III]λ5007/Hβ) vs. the radio-loudness parameter (L1.4 GHz/L5100 @@@(LBT)). Green dots represent galaxies with flat radio spectral index (−0.7 ≤ α1.4/4.85 ≤ −0.4), while red dots represent galaxies with inverted radio spectral index (α > −0.4). The vertical blue line represents the median value of the radio-loudness parameter for the non-radio detected galaxies from Table 31 and the magenta arrows indicate that this is the upper limit of the radio-loudness at the log([O III]λ5007/Hβ) values for each of the galaxies.
Current usage metrics show cumulative count of Article Views (full-text article views including HTML views, PDF and ePub downloads, according to the available data) and Abstracts Views on Vision4Press platform.
Data correspond to usage on the plateform after 2015. The current usage metrics is available 48-96 hours after online publication and is updated daily on week days.
Initial download of the metrics may take a while.