Open Access
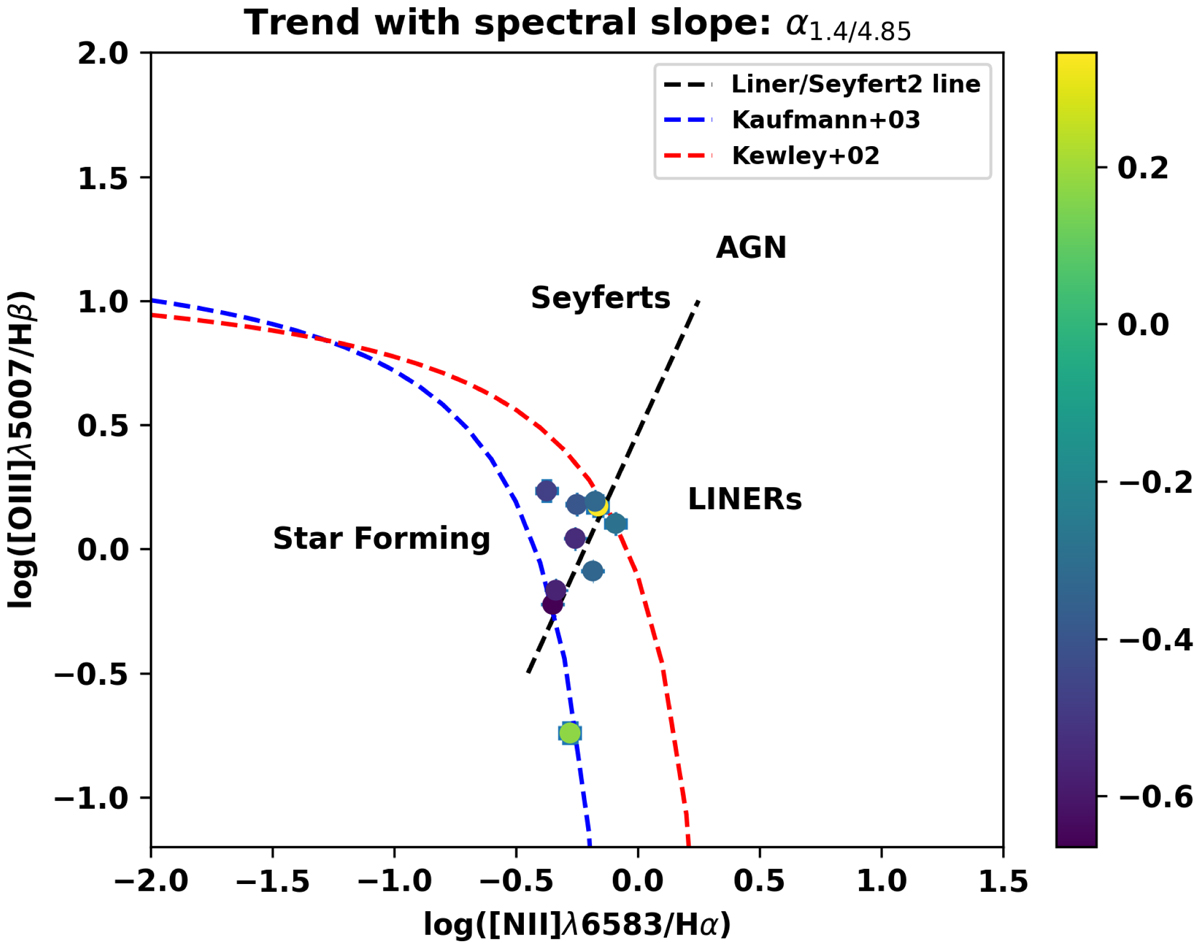
Fig. 6.
Download original image
Plot of log([O III]λ5007/Hβ) vs. log([N II]λ6583/Hα) with a colour map based on the radio spectral indices of the sources derived from radio fluxes of the sources at 1.4 GHz and 4.85 GHz.
Current usage metrics show cumulative count of Article Views (full-text article views including HTML views, PDF and ePub downloads, according to the available data) and Abstracts Views on Vision4Press platform.
Data correspond to usage on the plateform after 2015. The current usage metrics is available 48-96 hours after online publication and is updated daily on week days.
Initial download of the metrics may take a while.