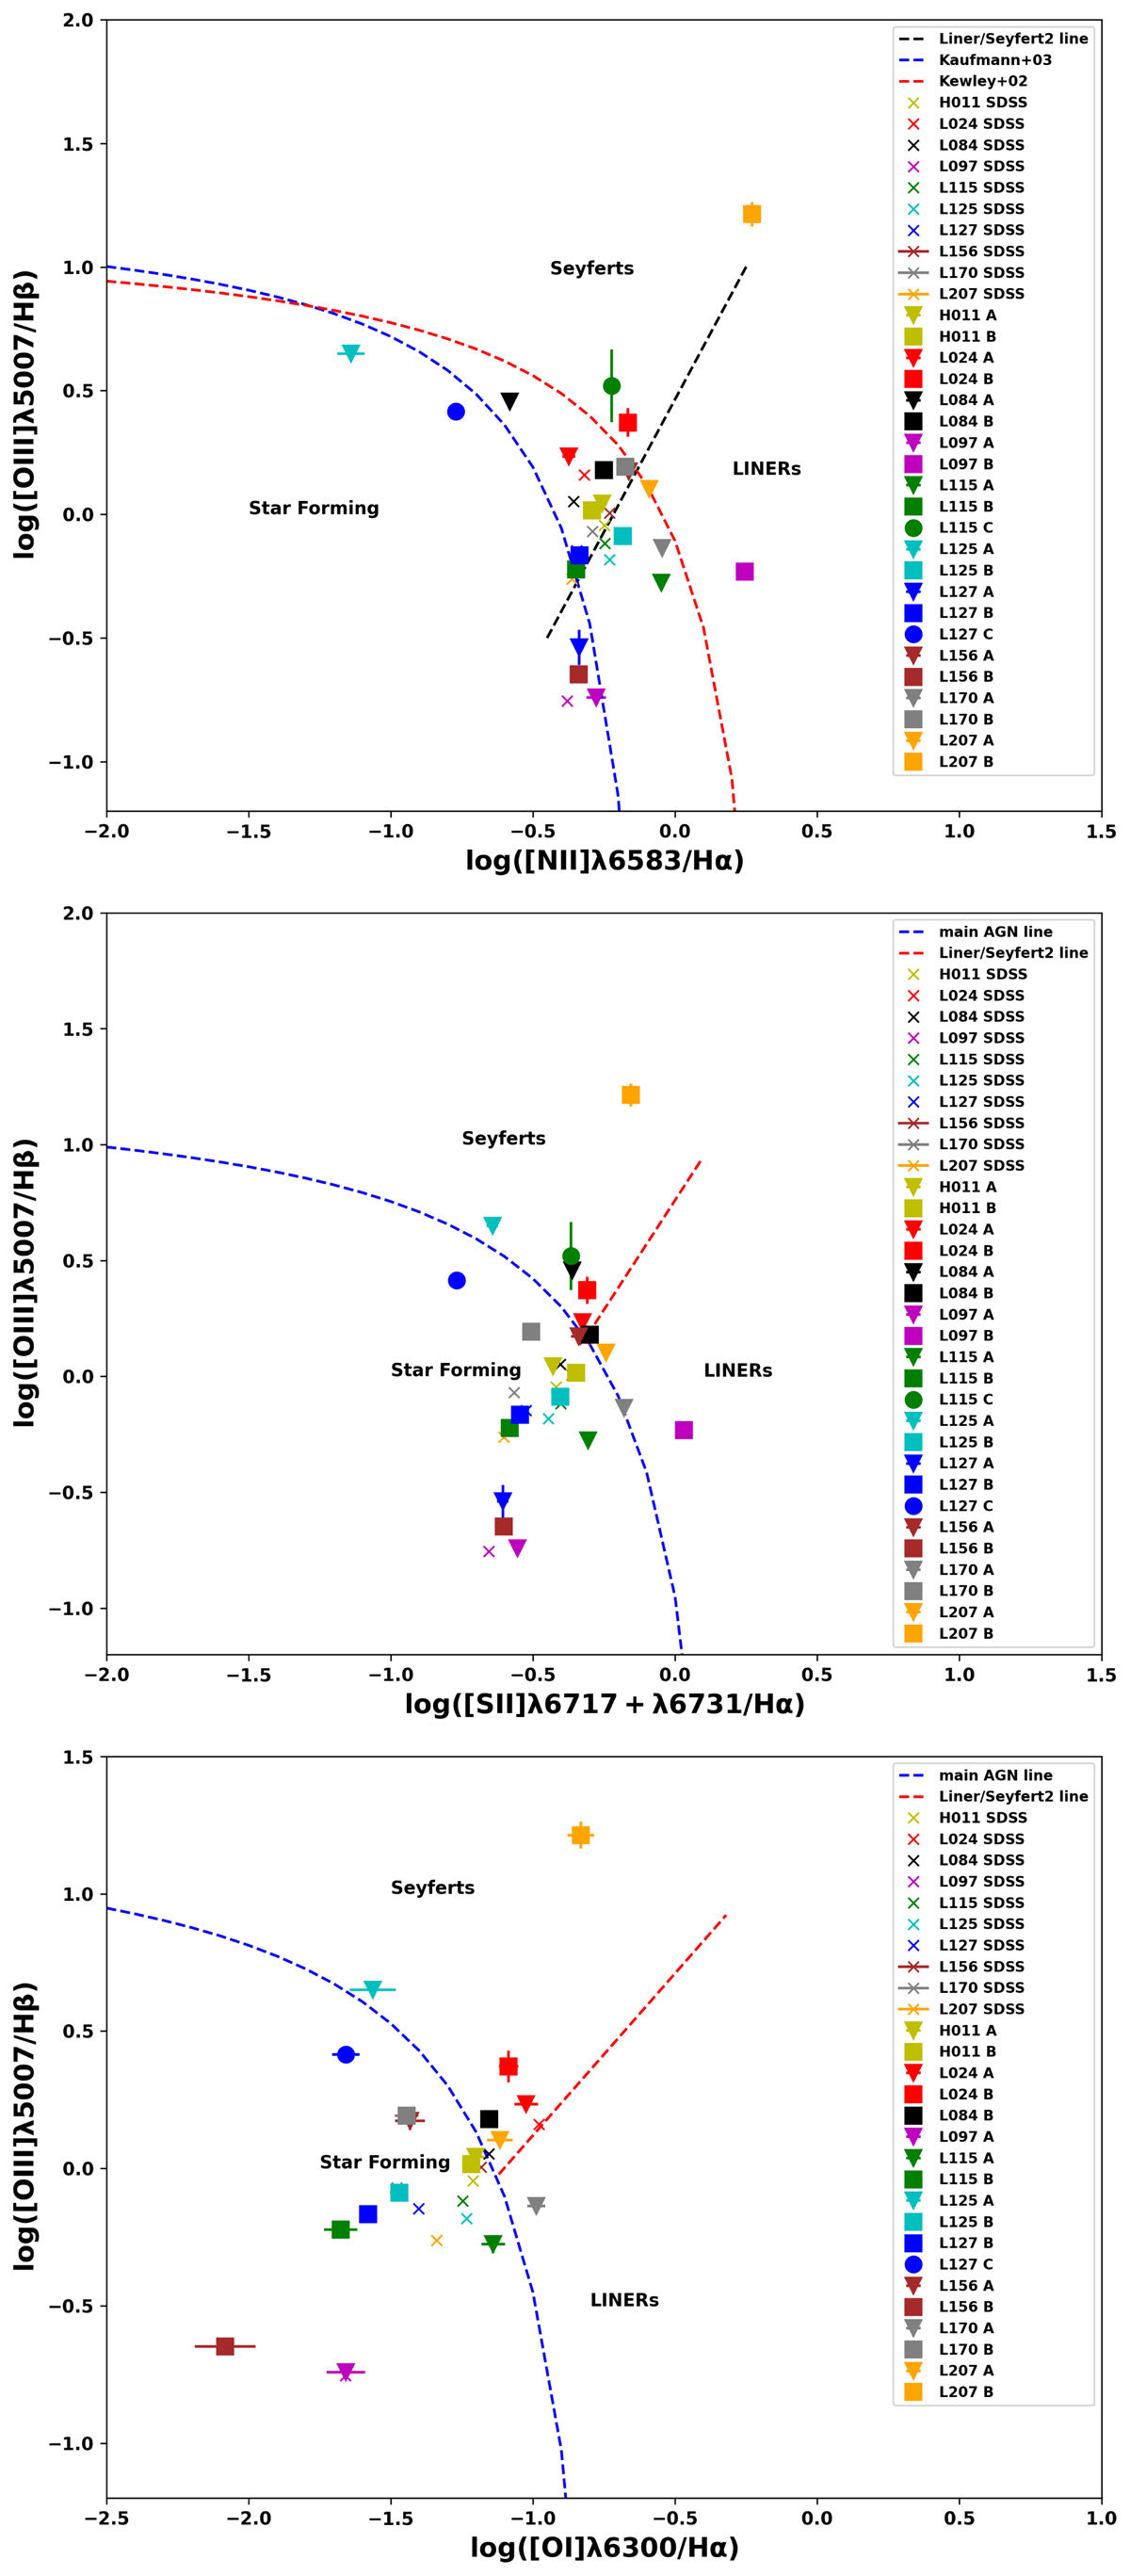
Fig. 5.
Download original image
Plots of log([O III]λ5007/Hβ) vs. log([N II]λ6583/Hα), log([O III]λ5007/Hβ) vs. log([S II](λ6717+λ6731)/Hα) and log([O III]λ5007/Hβ) vs. log([O I]λ6300/Hα). Each colour marks a particular interacting pair or group. The inverted triangles represent the data points corresponding to nucleus A of a given source, whereas the squares represent the nucleus B, filled circles represent nucleus C, where applicable, and the crosses mark the data point derived from the SDSS spectrum of the source. The data points have been calculated for an aperture of 1 arcsec. The error bars have been derived from the 1σ standard uncertainty values.
Current usage metrics show cumulative count of Article Views (full-text article views including HTML views, PDF and ePub downloads, according to the available data) and Abstracts Views on Vision4Press platform.
Data correspond to usage on the plateform after 2015. The current usage metrics is available 48-96 hours after online publication and is updated daily on week days.
Initial download of the metrics may take a while.