Open Access
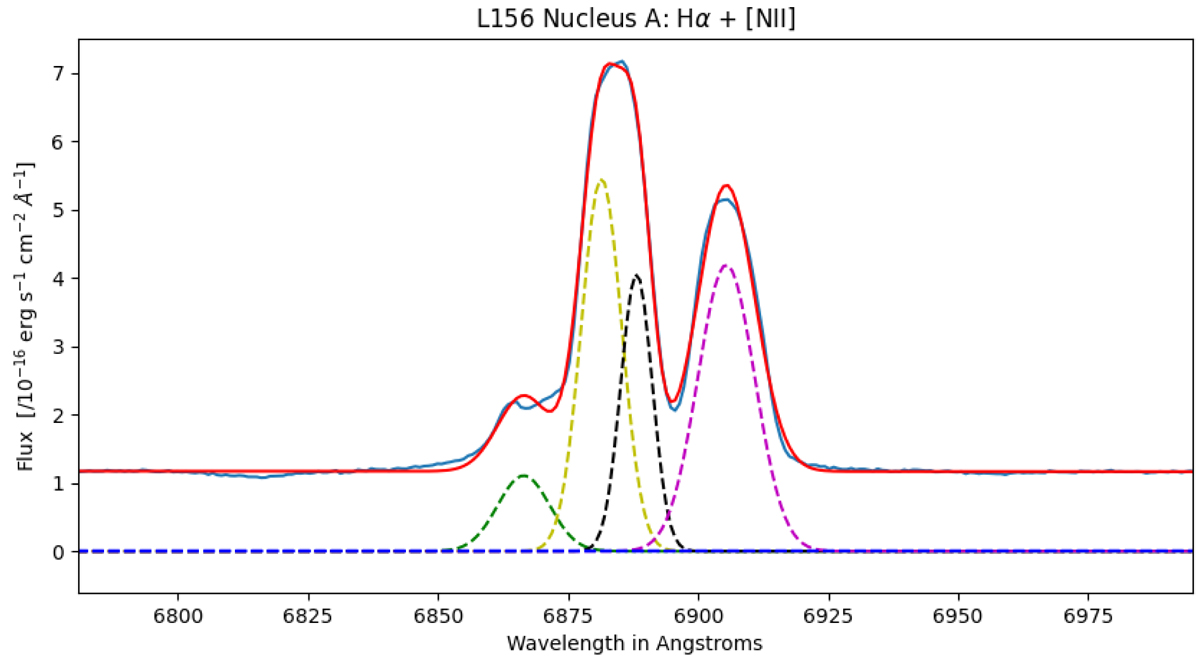
Fig. A.16.
Download original image
1D optical spectrum of the L156A nucleus, showing the Gaussian fitting performed over the Hα+[N II] component. The four narrow components used to perform the fitting are marked by green, yellow, black, and magenta dashed lines, while the best fit is represented by a red line.
Current usage metrics show cumulative count of Article Views (full-text article views including HTML views, PDF and ePub downloads, according to the available data) and Abstracts Views on Vision4Press platform.
Data correspond to usage on the plateform after 2015. The current usage metrics is available 48-96 hours after online publication and is updated daily on week days.
Initial download of the metrics may take a while.