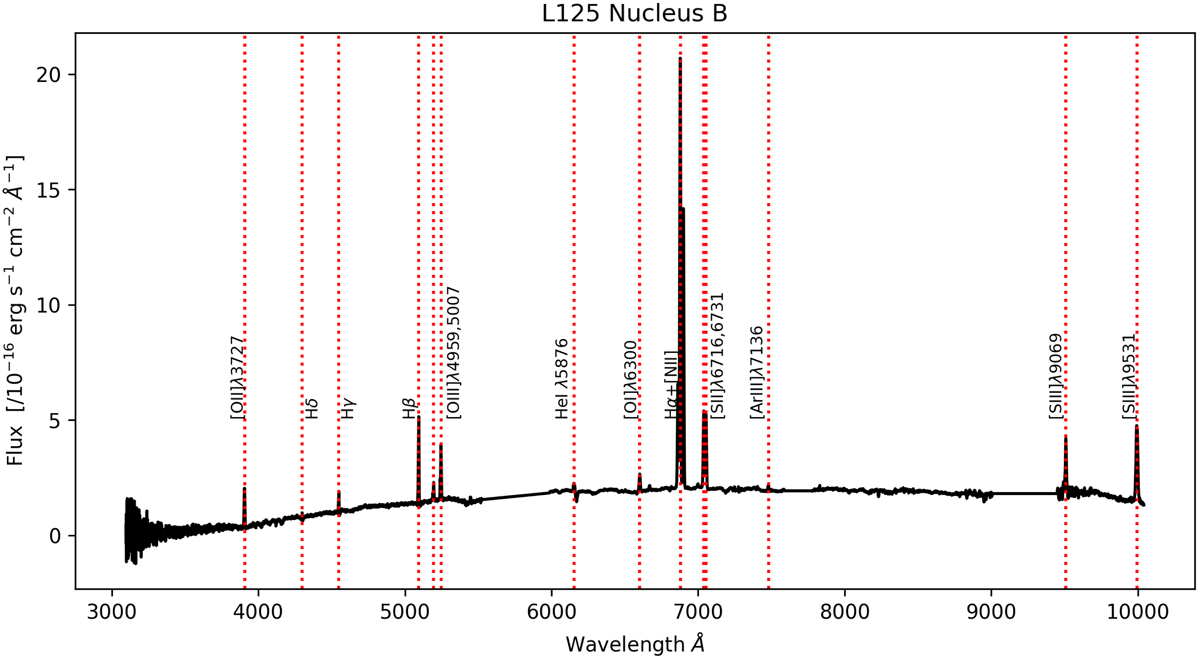
Fig. A.11.
Download original image
1D optical spectrum of the L125B nucleus, extracted over an aperture of ∼1.2 arcsec (∼1.2 kpc at given redshift). Prominent emission lines are marked and labelled. The x-axis represents the wavelength in Angstroms, while the y-axis depicts the flux in units of ergs s−1 cm−2 Å−1. The flattened part of the spectrum between 5500 and 6000 Å is the region where the end of the blue channel overlaps with the beginning of the red channel of MODS. Two additional sections beyond 7500 Åhave been normalised. They coincide with a sky absorption line and a noisy part of the spectrum.
Current usage metrics show cumulative count of Article Views (full-text article views including HTML views, PDF and ePub downloads, according to the available data) and Abstracts Views on Vision4Press platform.
Data correspond to usage on the plateform after 2015. The current usage metrics is available 48-96 hours after online publication and is updated daily on week days.
Initial download of the metrics may take a while.