Fig. 17.
Download original image
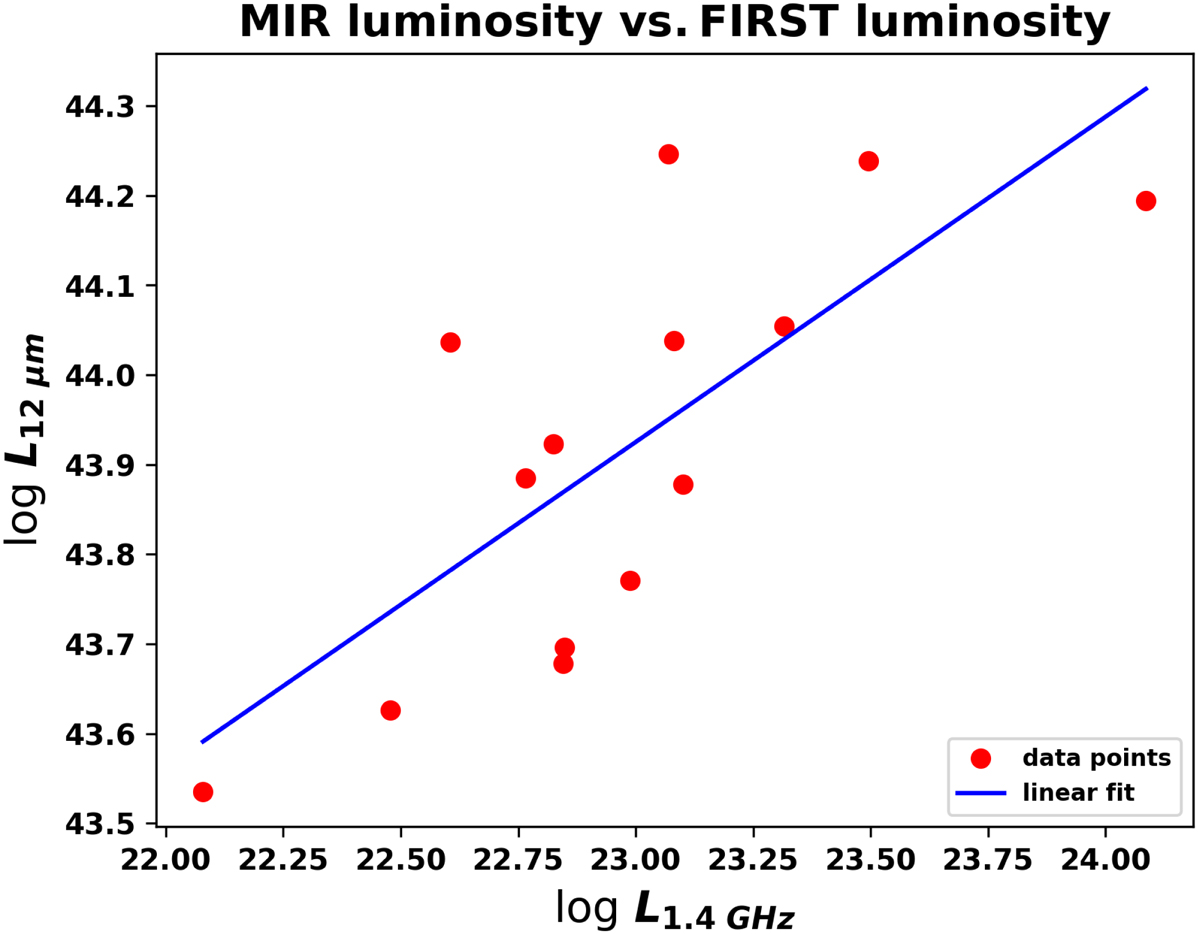
Plot of log values of the 12 μm luminosity, in erg s−1 units, of the galaxies detected by the WISE W3 band versus the log values of the 1.4 GHz luminosity, in W Hz−1 units, observed in the FIRST survey. The red dots are the data points for the galaxies in our sample. The solid blue line shows the linear regression fit to the data, described by L12 μm = 0.36L1.4 GHz + 35.58.
Current usage metrics show cumulative count of Article Views (full-text article views including HTML views, PDF and ePub downloads, according to the available data) and Abstracts Views on Vision4Press platform.
Data correspond to usage on the plateform after 2015. The current usage metrics is available 48-96 hours after online publication and is updated daily on week days.
Initial download of the metrics may take a while.