Open Access
Fig. 16.
Download original image
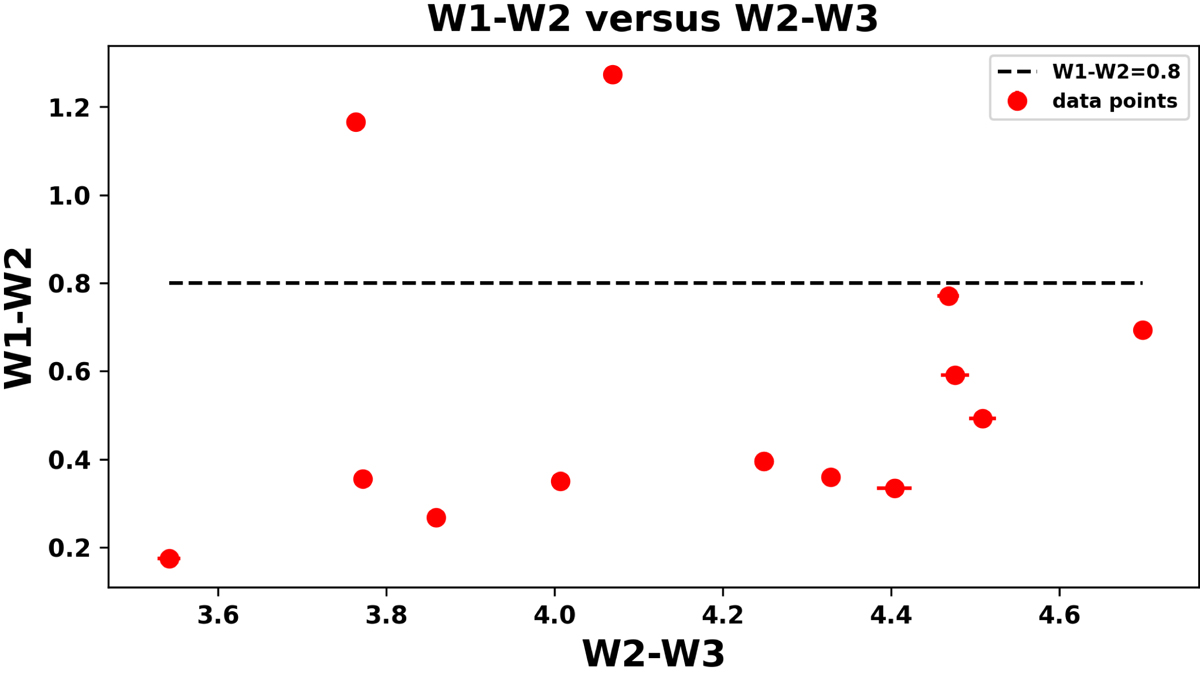
W1 − W2 versus W2 − W3 colour-colour diagram based on the WISE magnitudes at 3.4 μm, 4.6 μm, and 12 μm. The red dots are the data points for the galaxies in our sample. The dashed black line shows the W1 − W2 > 0.8 criterion proposed by Stern et al. (2012).
Current usage metrics show cumulative count of Article Views (full-text article views including HTML views, PDF and ePub downloads, according to the available data) and Abstracts Views on Vision4Press platform.
Data correspond to usage on the plateform after 2015. The current usage metrics is available 48-96 hours after online publication and is updated daily on week days.
Initial download of the metrics may take a while.