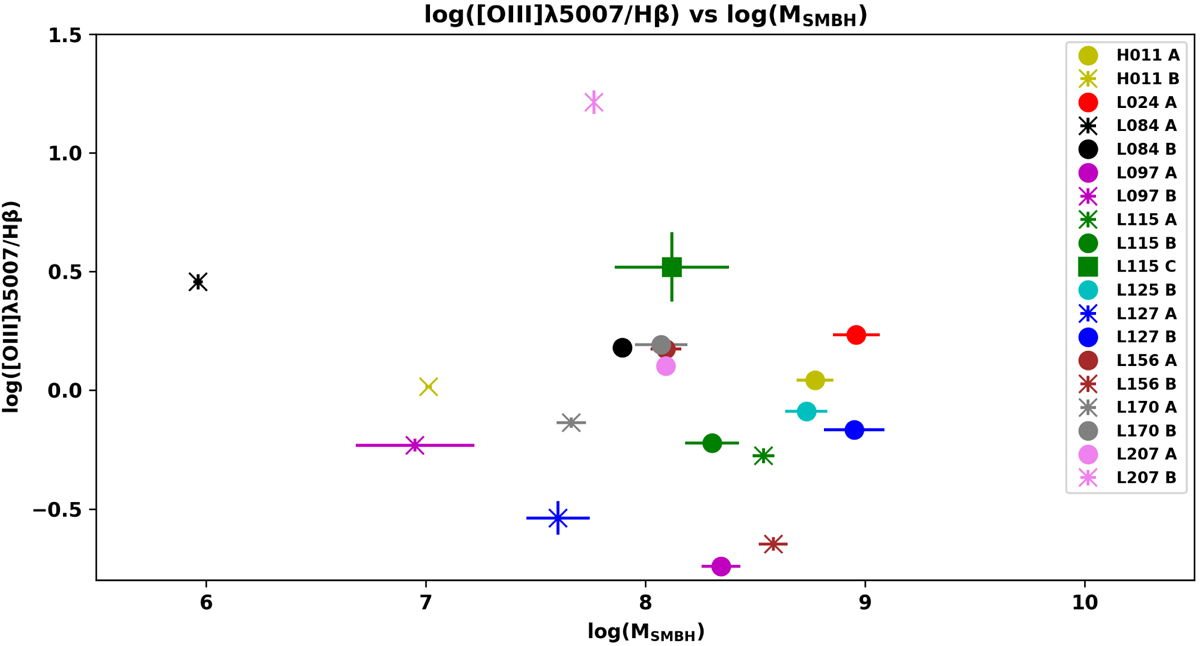
Fig. 14.
Download original image
Plot of the ionisation ratio of each galactic nuclear region versus the mass of the central SMBH. The crosses and square represent the masses of the non-radio detected galaxies, while the dots represent the radio detected galaxies. Each interacting pair is represented by a specific colour, as described in the legend of the plot.
Current usage metrics show cumulative count of Article Views (full-text article views including HTML views, PDF and ePub downloads, according to the available data) and Abstracts Views on Vision4Press platform.
Data correspond to usage on the plateform after 2015. The current usage metrics is available 48-96 hours after online publication and is updated daily on week days.
Initial download of the metrics may take a while.