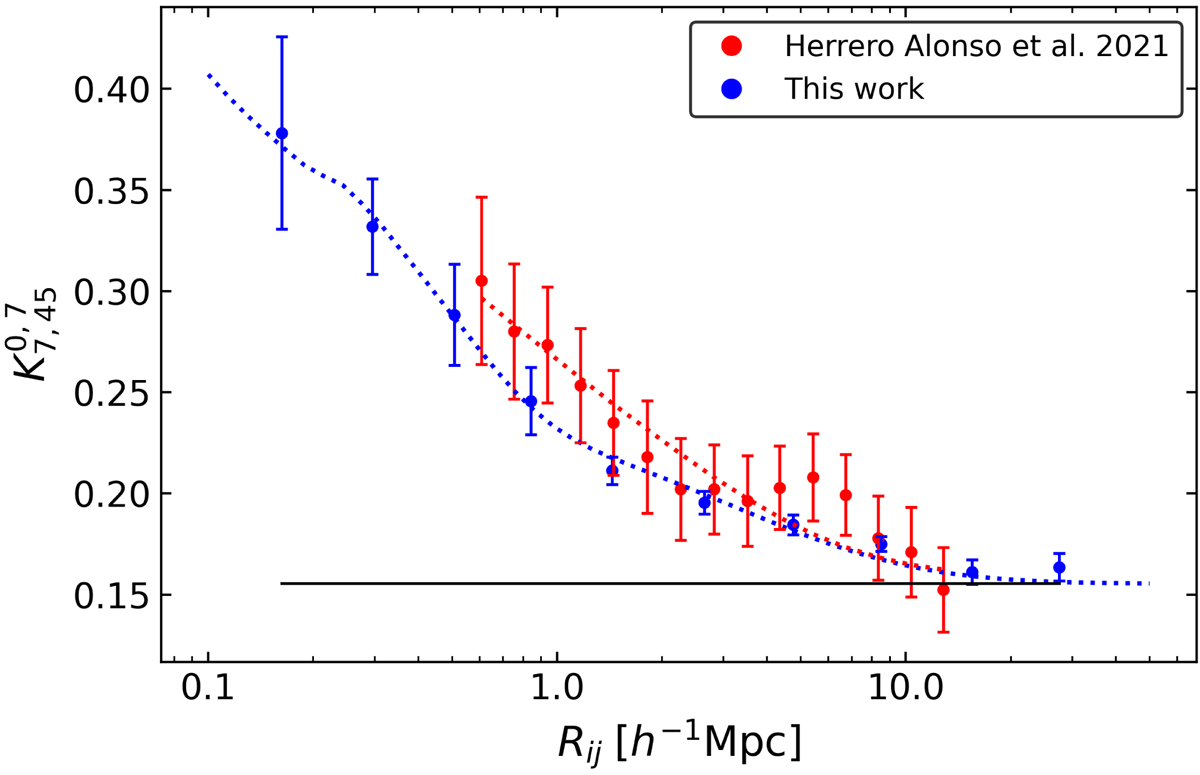
Fig. 9.
Download original image
Clustering of the full MUSE-Wide sample (blue; this work) compared to the subset considered in HA21 (red). The former measurements show jackknife uncertainties (see Sect. 3.2.1) and the latter bootstrapping errors (see Sect. 3.1.3 in HA21). The blue dotted curve represents our best-fit from full HOD modeling. The red dotted curve displays the two-halo term only best HOD fit found in Sect. 4.3 of HA21. The black straight line shows the expected K value of an unclustered sample.
Current usage metrics show cumulative count of Article Views (full-text article views including HTML views, PDF and ePub downloads, according to the available data) and Abstracts Views on Vision4Press platform.
Data correspond to usage on the plateform after 2015. The current usage metrics is available 48-96 hours after online publication and is updated daily on week days.
Initial download of the metrics may take a while.