Fig. 5.
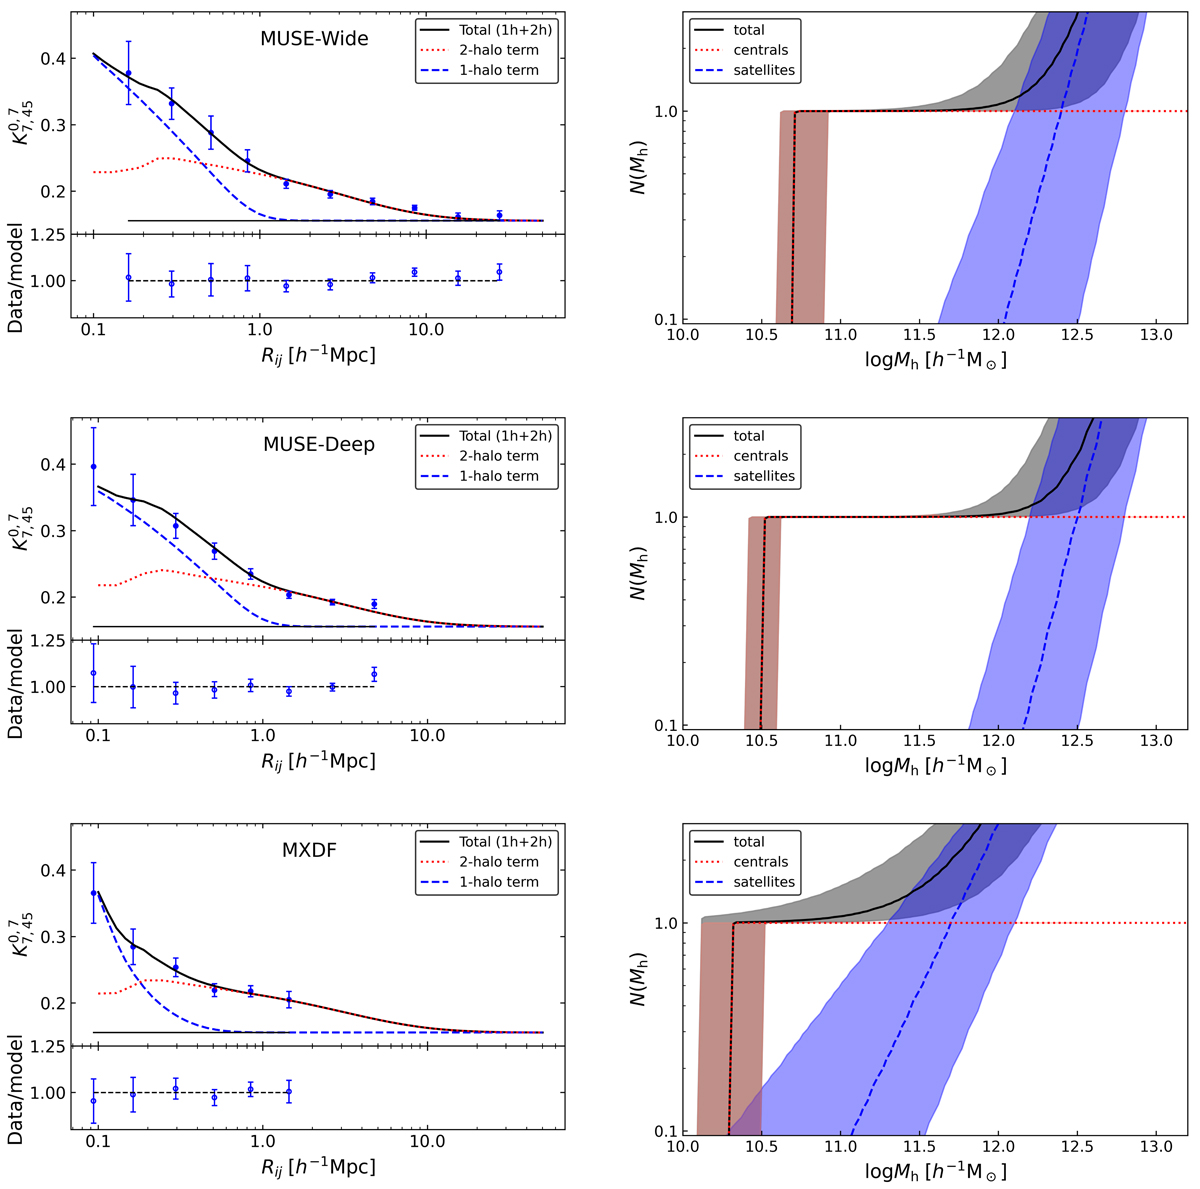
Download original image
Best-fit HOD models to the LAE clustering measurements (blue data points) from MUSE samples. Top left: blue dashed, red dotted, and black continuous curves show the one-halo, two-halo, and total clustering terms from the MUSE-Wide sample, respectively. The black straight line shows the expected K value of an unclustered sample. The residuals are shown below. The uncertainties are computed with the jackknife technique described in Sect. 3.2.1. Top right: best-fit HODs for central (red dotted), satellite (blue dashed), and total LAEs (black continuous) from the MUSE-Wide survey. Shaded regions correspond to 1σ confidence space. Middle: Same but for MUSE-Deep and using Poisson error bars. Bottom: same but for MXDF and Poisson uncertainties.
Current usage metrics show cumulative count of Article Views (full-text article views including HTML views, PDF and ePub downloads, according to the available data) and Abstracts Views on Vision4Press platform.
Data correspond to usage on the plateform after 2015. The current usage metrics is available 48-96 hours after online publication and is updated daily on week days.
Initial download of the metrics may take a while.