Open Access
Fig. 3.
Download original image
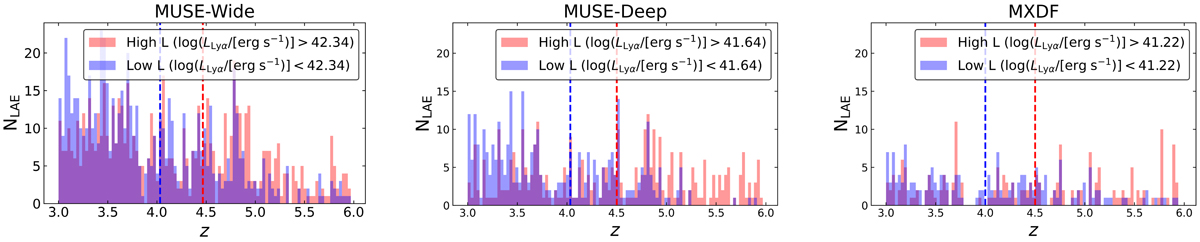
Redshift distribution of the subsamples bisected at the median Lyα luminosity of MUSE-Wide, MUSE-Deep and MXDF (panels from left to right). Blue (red) colors show the low- (high-) luminosity subsets. The vertical dashed lines represent the median redshift of the corresponding subsample.
Current usage metrics show cumulative count of Article Views (full-text article views including HTML views, PDF and ePub downloads, according to the available data) and Abstracts Views on Vision4Press platform.
Data correspond to usage on the plateform after 2015. The current usage metrics is available 48-96 hours after online publication and is updated daily on week days.
Initial download of the metrics may take a while.