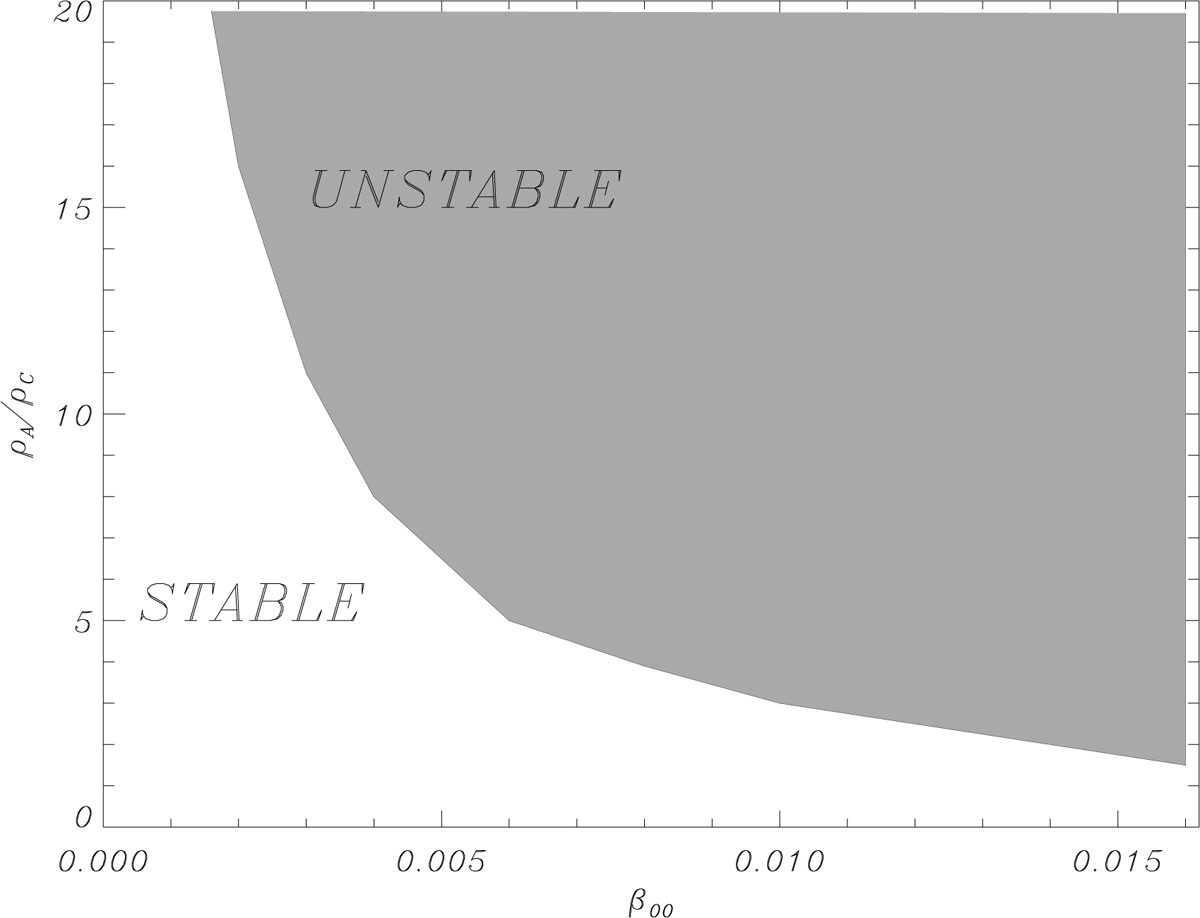
Fig. 11.
Download original image
Stability diagram for a bipolar configuration. The gray region corresponds to unstable solutions, while the white region corresponds to stable states. The vertical axis represents the density contrast between the core of the AR and the external environment, while the horizontal axis corresponds to the reference plasma-β, β00. In this plot, we have used a bipole with d = 0.25 and z0 = 0.5 in the domain xmin = −2, xmax = 2, ymin = −2, ymax = 2, zmin = 0, and zmax = 4. The temperature contrast, TAR = 2 TC, is the same for all the points.
Current usage metrics show cumulative count of Article Views (full-text article views including HTML views, PDF and ePub downloads, according to the available data) and Abstracts Views on Vision4Press platform.
Data correspond to usage on the plateform after 2015. The current usage metrics is available 48-96 hours after online publication and is updated daily on week days.
Initial download of the metrics may take a while.