Fig. 1.
Download original image
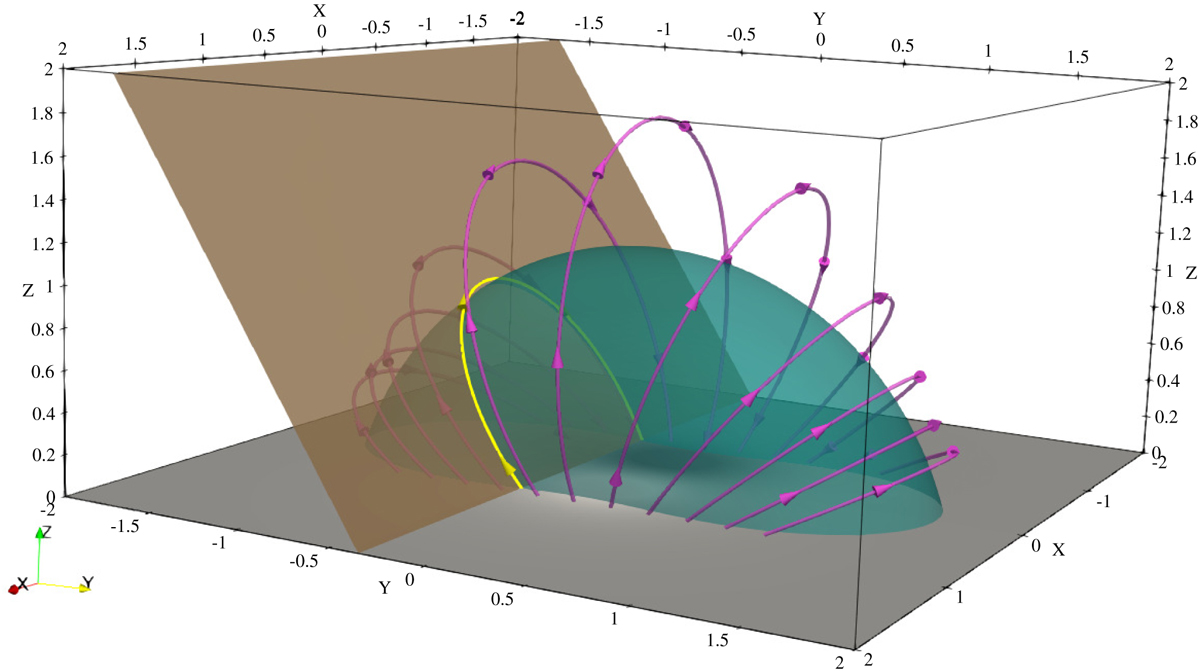
Sketch of the bipolar configuration. Potential magnetic field lines (pink curves with arrows) and two magnetic surfaces associated to the EPs α (green color) and β (brown color) for a bipole with d = 0.25 and z0 = 0.5 (all the lengths are hereafter normalised to H). The intersection of the two surfaces, see the yellow curve, represents a particular magnetic field line. The distribution of the vertical component of the magnetic field at z = 0 is represented in gray colors.
Current usage metrics show cumulative count of Article Views (full-text article views including HTML views, PDF and ePub downloads, according to the available data) and Abstracts Views on Vision4Press platform.
Data correspond to usage on the plateform after 2015. The current usage metrics is available 48-96 hours after online publication and is updated daily on week days.
Initial download of the metrics may take a while.