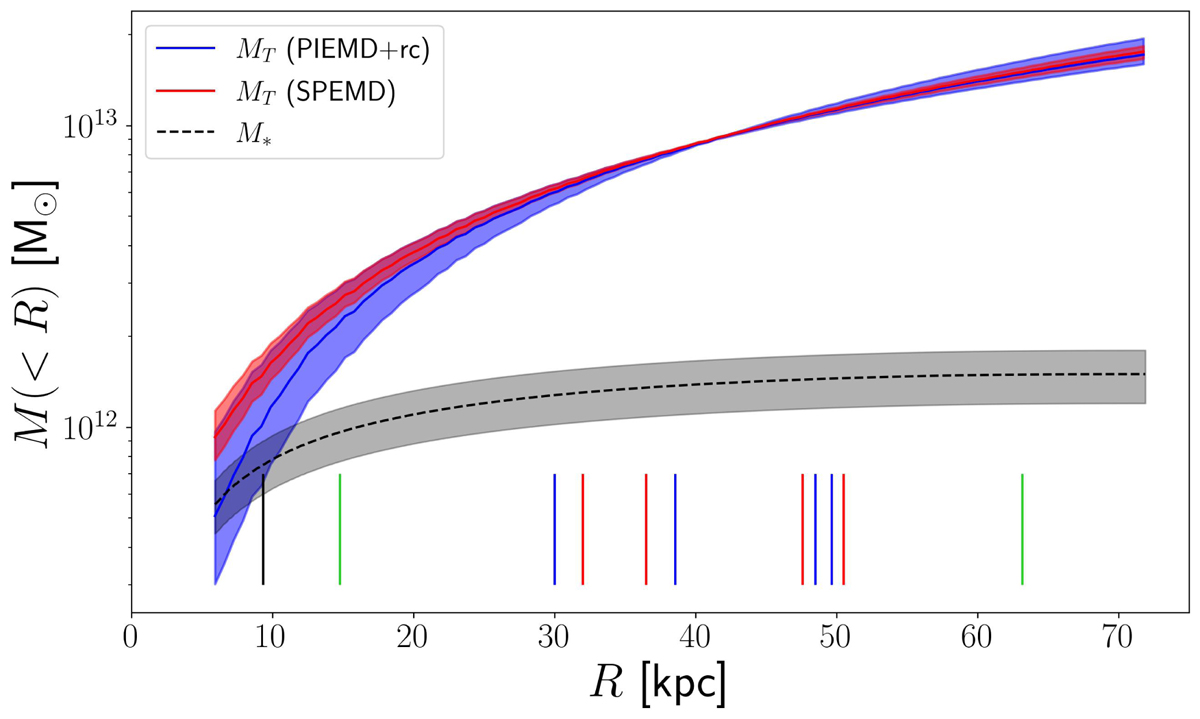
Fig. 9.
Download original image
Cumulative projected total mass profiles for the PIEMD+rc (blue) and SPEMD (red) models with ±1σ uncertainties (shaded areas), obtained by modeling the multiple images of A, B, and C as point-like objects. The cumulative projected stellar mass profile from Fig. 4 is shown in dashed black. The vertical lines close to the x-axis locate the distances from the lens galaxy center of the different multiple images, color-coded following Figs. 1 and 6. The black line shows the effective radius of the main lens galaxy.
Current usage metrics show cumulative count of Article Views (full-text article views including HTML views, PDF and ePub downloads, according to the available data) and Abstracts Views on Vision4Press platform.
Data correspond to usage on the plateform after 2015. The current usage metrics is available 48-96 hours after online publication and is updated daily on week days.
Initial download of the metrics may take a while.