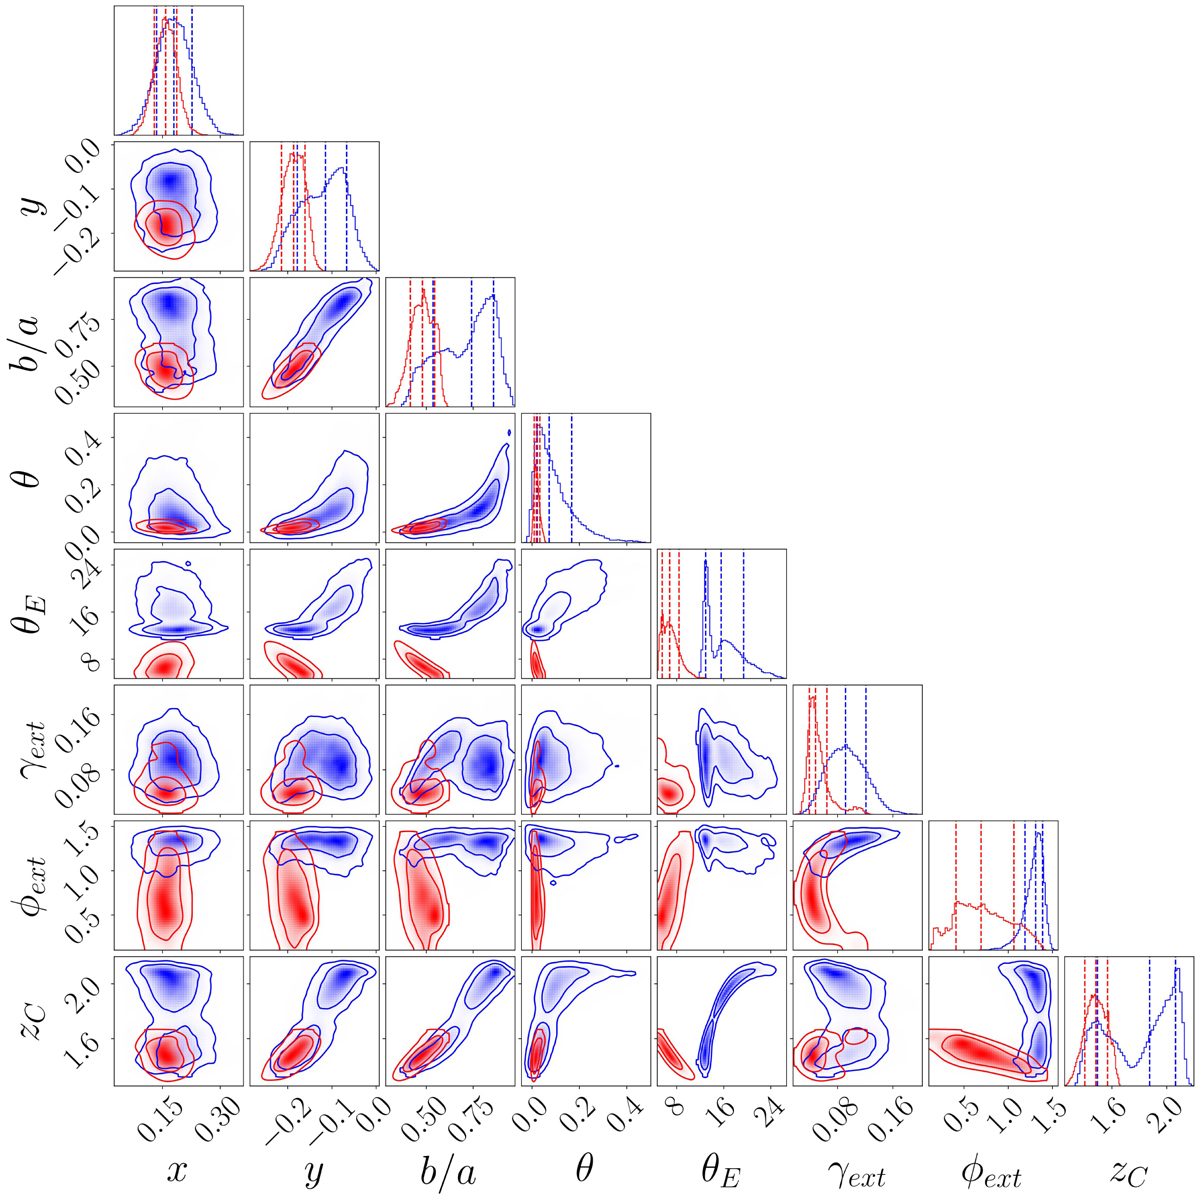
Fig. 7.
Download original image
Probability density distributions of the parameters of the PIEMD+rc (in blue) and SPEMD (in red) models. The marginalized 1D histograms of each parameter are shown along the diagonal, while the other panels show the joint 2D probability distributions of the two parameters reported on the horizontal and vertical axes. The parameters plotted are those introduced in Sect. 4.1. The vertical dashed lines in the 1D histograms represent the 16th, 50th, and 84th percentiles, while the solid lines in the 2D distributions represent the 0.68 and 0.95 contour levels.
Current usage metrics show cumulative count of Article Views (full-text article views including HTML views, PDF and ePub downloads, according to the available data) and Abstracts Views on Vision4Press platform.
Data correspond to usage on the plateform after 2015. The current usage metrics is available 48-96 hours after online publication and is updated daily on week days.
Initial download of the metrics may take a while.