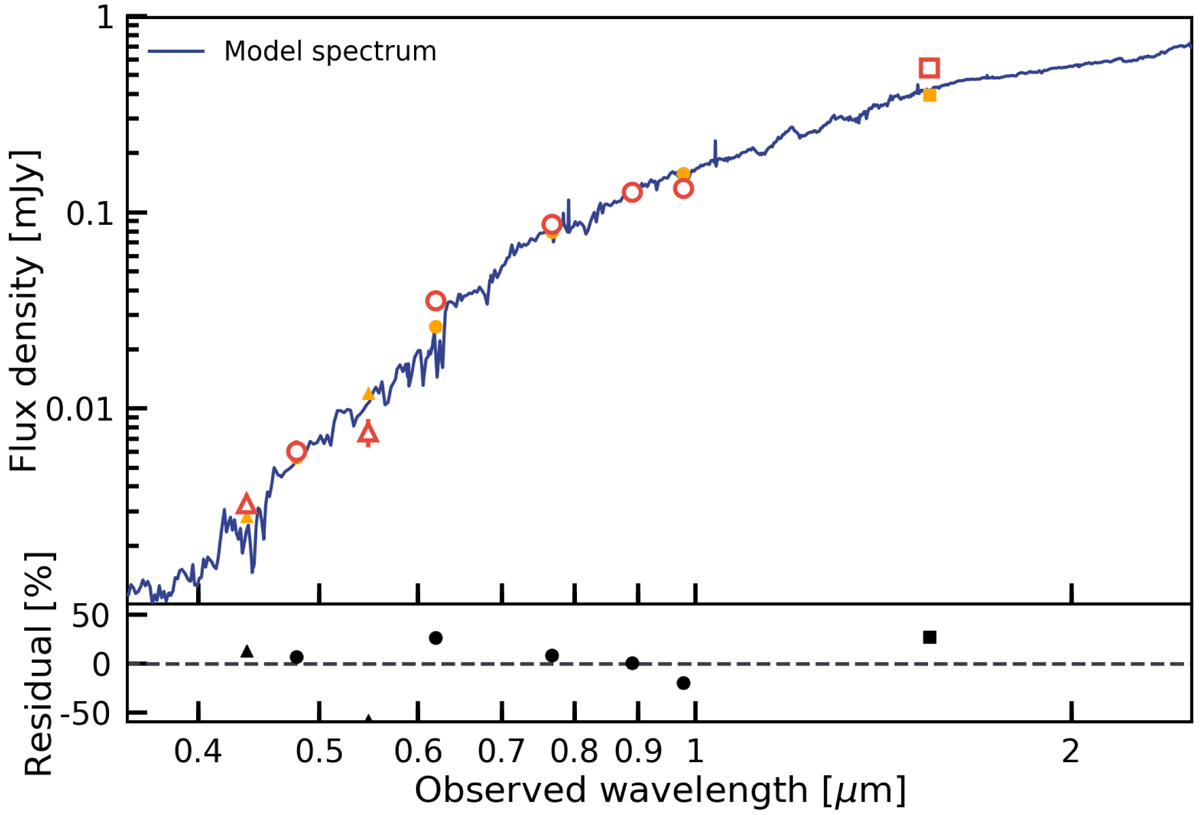
Fig. 2.
Download original image
Spectral energy distribution of the main lens galaxy of SDSS J0100+1818. The observed flux densities from NOT (red triangles), Pan-STARRS (red circles), and HST (red square) are used to fit the SED with the CIGALE software. Error bars are smaller than the symbols. The best-fit stellar continuum template (blue curve) corresponds to the model fluxes plotted in orange and is used to infer the total stellar mass value of the deflector. The bottom panel shows the relative residuals of the fit.
Current usage metrics show cumulative count of Article Views (full-text article views including HTML views, PDF and ePub downloads, according to the available data) and Abstracts Views on Vision4Press platform.
Data correspond to usage on the plateform after 2015. The current usage metrics is available 48-96 hours after online publication and is updated daily on week days.
Initial download of the metrics may take a while.