Open Access
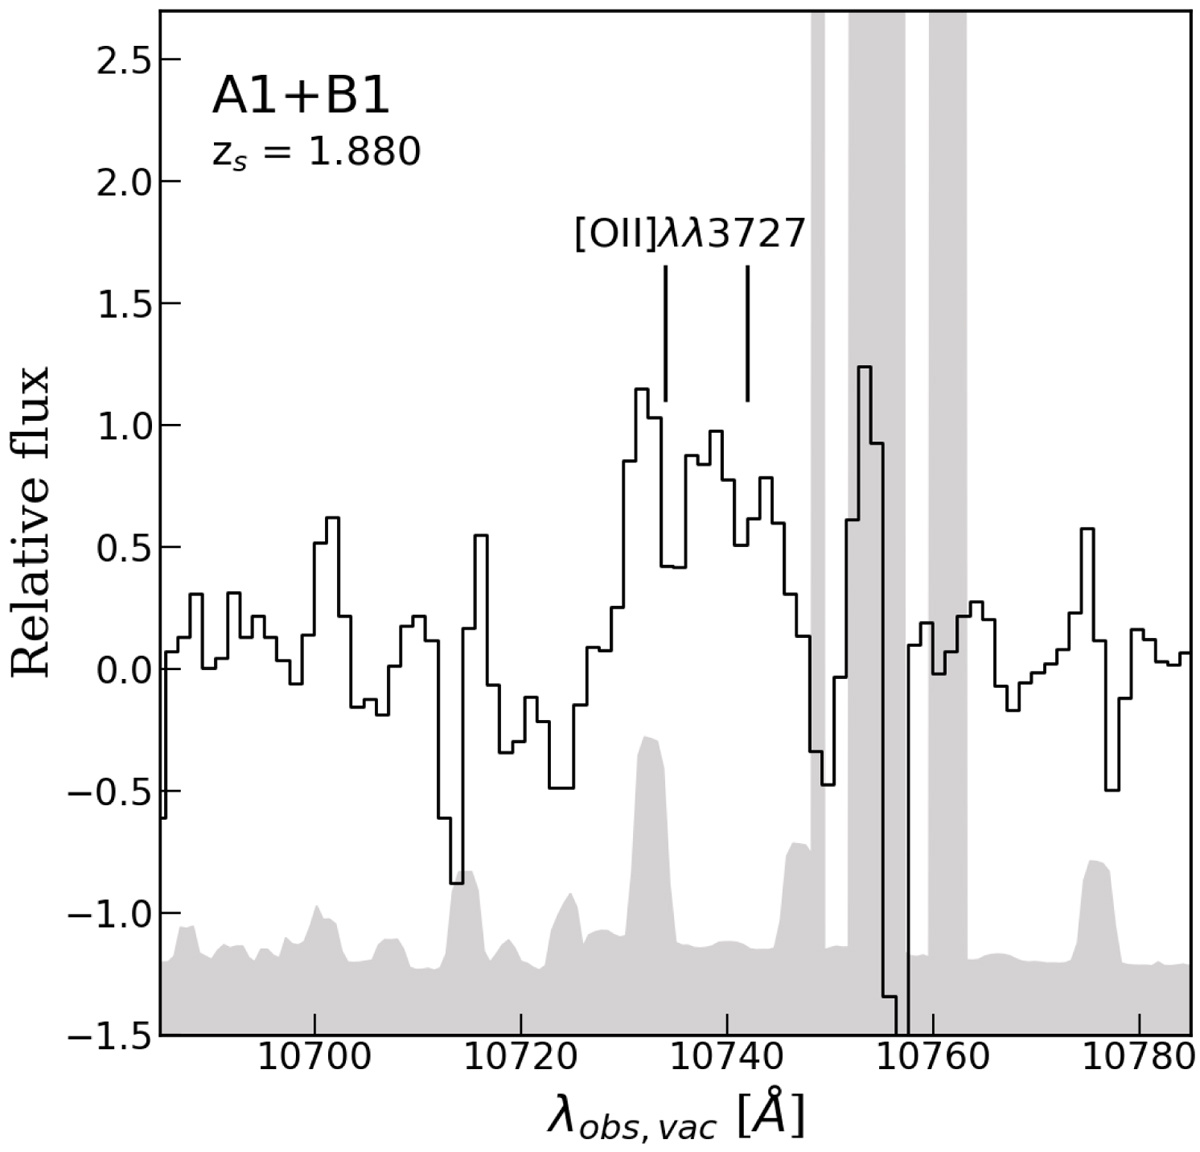
Fig. A.1.
Download original image
X-shooter 1D spectra of the multiple images A1 and B1. Zoom in of the wavelength range where we observe the main emission lines used to confirm the redshift measurement. The black lines are the observed spectra in units of 10−17 erg s−1 cm−2 Å−1, and the gray regions indicate the data variance.
Current usage metrics show cumulative count of Article Views (full-text article views including HTML views, PDF and ePub downloads, according to the available data) and Abstracts Views on Vision4Press platform.
Data correspond to usage on the plateform after 2015. The current usage metrics is available 48-96 hours after online publication and is updated daily on week days.
Initial download of the metrics may take a while.