Fig. 12.
Download original image
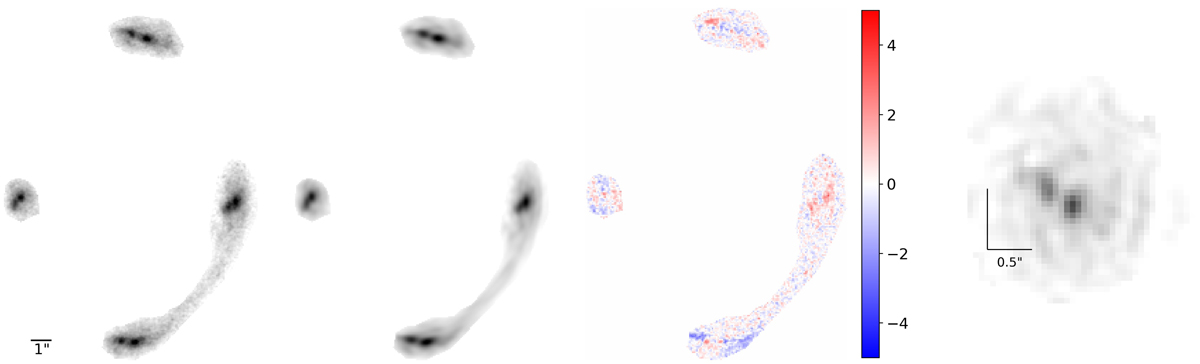
PIEMD model with one source. From the left to the right: observed SB in the F160W band of the multiple images considered in the extended source modeling; model-predicted SB; normalized residuals in the range from −5σ to +5σ; reconstructed SB of the source on a 40 × 40 pixel grid. Angular scales of 1″ and of 0.5″ are represented on the lens and source plane, respectively.
Current usage metrics show cumulative count of Article Views (full-text article views including HTML views, PDF and ePub downloads, according to the available data) and Abstracts Views on Vision4Press platform.
Data correspond to usage on the plateform after 2015. The current usage metrics is available 48-96 hours after online publication and is updated daily on week days.
Initial download of the metrics may take a while.