Open Access
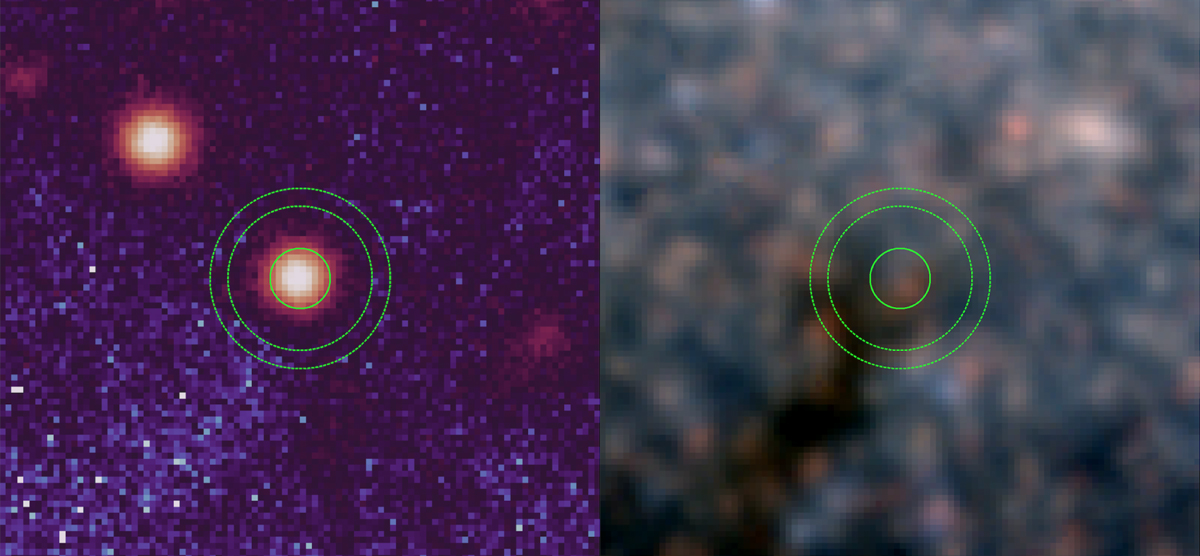
Fig. 9.
Download original image
False colour map (left) and RGB colour map (right) of the region surrounding PN A-23. The flux scaling is logarithmic. The images are 20″ × 20″ (∼180 × 180 pc) each. The green markers illustrate the main and sky aperture. The dust patch is clearly visible in the RGB image, overlapped with PN A-23.
Current usage metrics show cumulative count of Article Views (full-text article views including HTML views, PDF and ePub downloads, according to the available data) and Abstracts Views on Vision4Press platform.
Data correspond to usage on the plateform after 2015. The current usage metrics is available 48-96 hours after online publication and is updated daily on week days.
Initial download of the metrics may take a while.