Fig. 9
Download original image
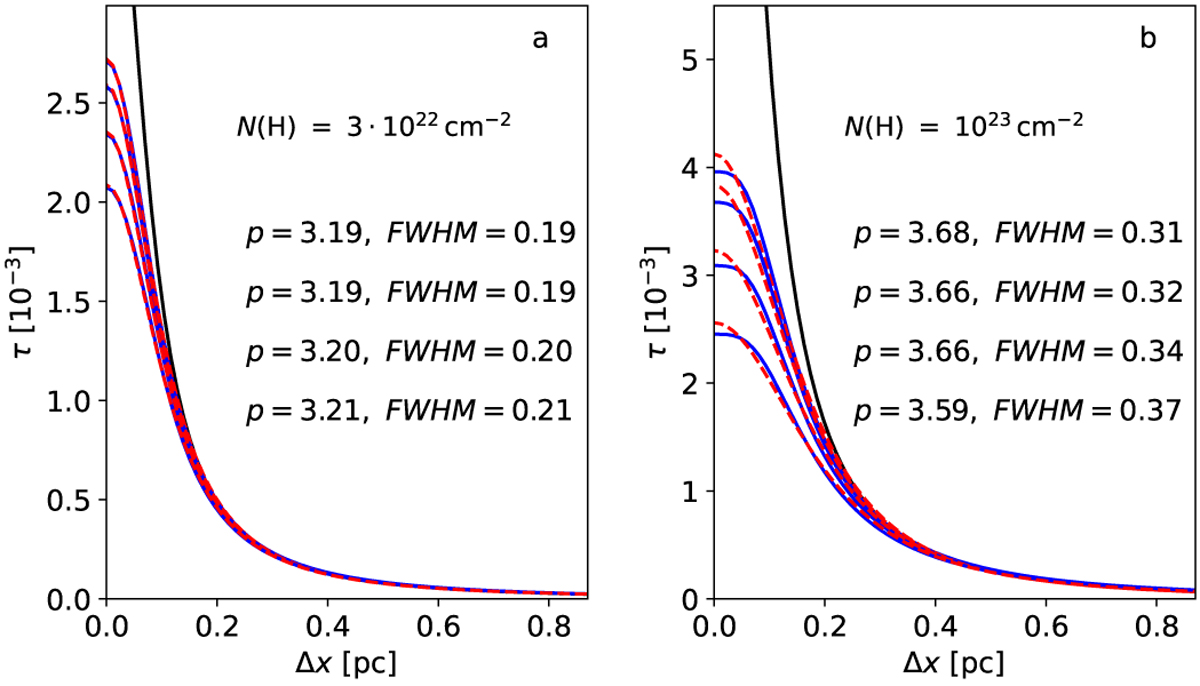
Selected optical-depth profiles along model filaments that are illuminated by a point source. The filament column density is N(H2) = 3 × 1022 cm−2 (frame a) or N(H2) = 1 × 1023 cm−2 (frame b). The black curves show the true optical depths, the blue curves the optical depths estimated from FIR observations, and the dashed red curves the Plummer fits to those optical depths. The cross-sections are selected from positions Δy = 0.46, 0.93, 1.39, and 1.86 pc along the filament, when the point source is located at the position Δy = 2.09 pc along the filament and a distance 0.93 pc behind the filament. The curves from top to bottom are in order of decreasing distance to the point source (increasing order of Δy), and the parameters are listed in the same order (FWHM in units of parsec).
Current usage metrics show cumulative count of Article Views (full-text article views including HTML views, PDF and ePub downloads, according to the available data) and Abstracts Views on Vision4Press platform.
Data correspond to usage on the plateform after 2015. The current usage metrics is available 48-96 hours after online publication and is updated daily on week days.
Initial download of the metrics may take a while.