Fig. 8
Download original image
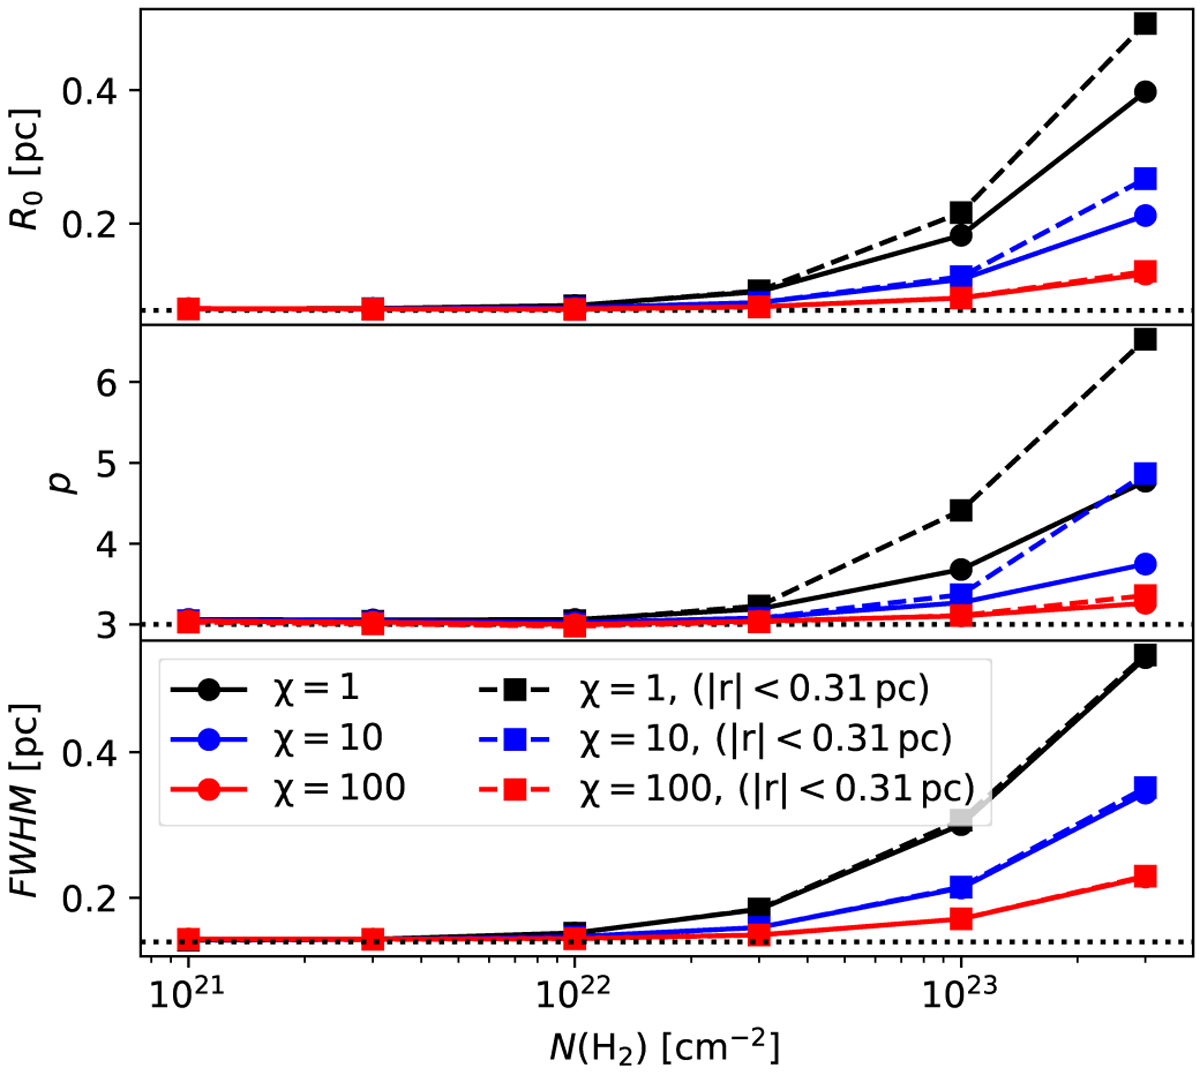
Estimated p and R values and the corresponding FWHM as a function of the peak column density of isotropically illuminated model filaments. The black, blue, and red curves correspond, respectively, to observations of model filaments in a normal ISRF, χ = 1, and in stronger fields with χ =10 and χ = 100. The solid lines with circles are fits to the model profile at |r| < 0.58 pc, while the dashed lines with squares are fits to a narrower region, |r| < 0.35 pc. The horizontal dotted lines indicate the true parameter values in the models.
Current usage metrics show cumulative count of Article Views (full-text article views including HTML views, PDF and ePub downloads, according to the available data) and Abstracts Views on Vision4Press platform.
Data correspond to usage on the plateform after 2015. The current usage metrics is available 48-96 hours after online publication and is updated daily on week days.
Initial download of the metrics may take a while.