Fig. 7
Download original image
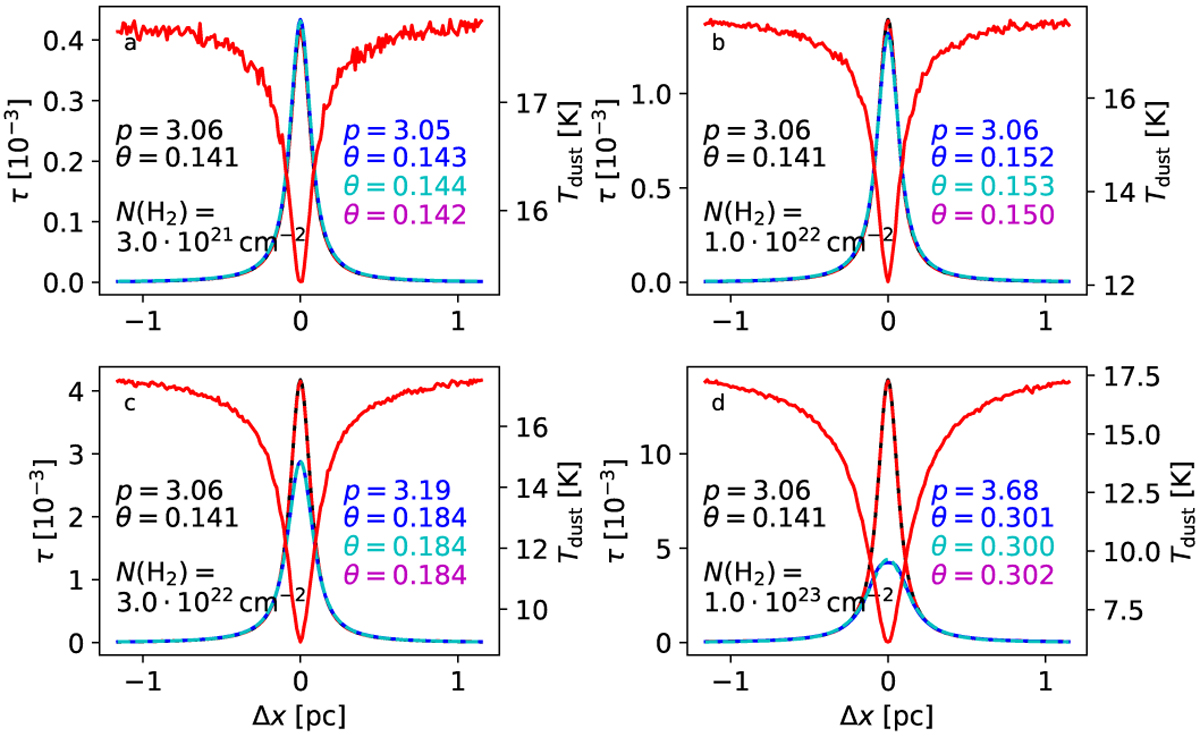
Profiles of optical depth, τ, and dust temperature in the case of model filaments illuminated by an isotropic external field. The black curves show the true optical-depth profiles and the dashed red curves (fully overlapping the black curves) the Plummer functions fitted to those profiles. The blue and dashed cyan lines are, respectively, the optical depth profile derived from synthetic 160–500 μm surface brightness observations and the Plummer fit to those data. The values of p and FWHM (in parsecs, in the plot marked as θ) are shown for both the true profile (left side, black font) and the estimated (right side, blue font) τ profiles. The analysis assumes β = 2.0, but FWHM values for β = 1.8 and β = 2.2 are also shown in cyan and magenta, respectively. The assumed beam size is 24″. The dust temperature profiles (solid red curves) are cross-sections of the 3D model and are shown at full model resolution.
Current usage metrics show cumulative count of Article Views (full-text article views including HTML views, PDF and ePub downloads, according to the available data) and Abstracts Views on Vision4Press platform.
Data correspond to usage on the plateform after 2015. The current usage metrics is available 48-96 hours after online publication and is updated daily on week days.
Initial download of the metrics may take a while.