Fig. G.1
Download original image
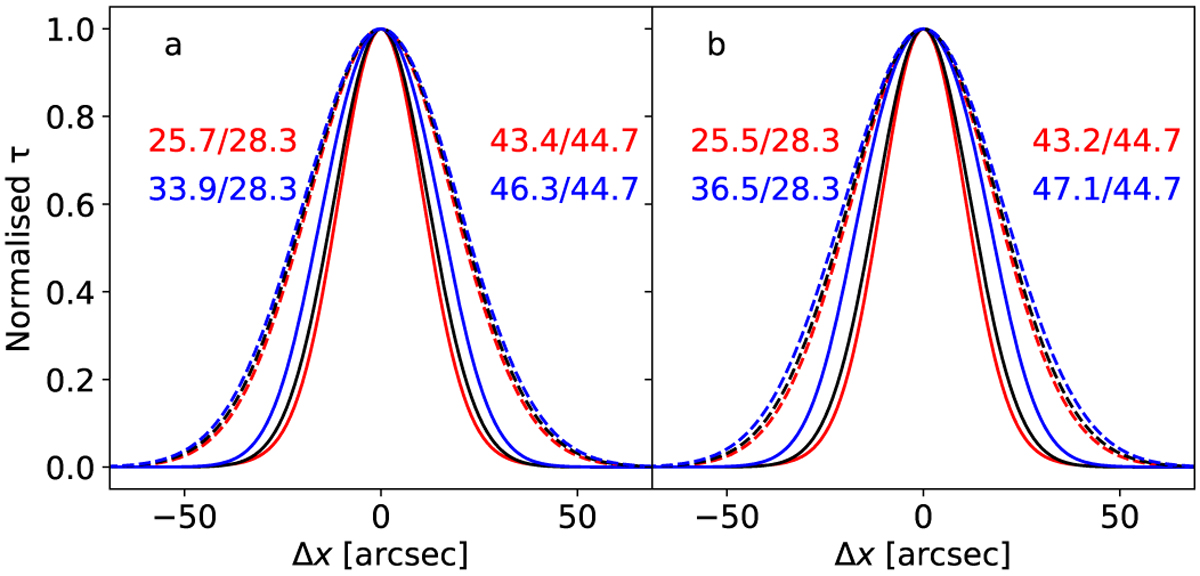
Optical-depth profiles of toy models consisting of 10 Κ and 20 Κ dust. The model in the left frame is a Gaussian sphere, and the model on the right a cylinder with the same Gaussian cross-section with FWHM = 20″. The black curves are the expected profiles observed at 20″ and 40″ resolution. The actually profiles (from HR and LR maps) are plotted in red (models with warm centre) and blue (models with cold centre), where solid lines show the HR and the dashed lines the LR results. The estimated and expected FWHM values are quoted in the same colours (HR on left, and LR on right side).
Current usage metrics show cumulative count of Article Views (full-text article views including HTML views, PDF and ePub downloads, according to the available data) and Abstracts Views on Vision4Press platform.
Data correspond to usage on the plateform after 2015. The current usage metrics is available 48-96 hours after online publication and is updated daily on week days.
Initial download of the metrics may take a while.