Fig. 4
Download original image
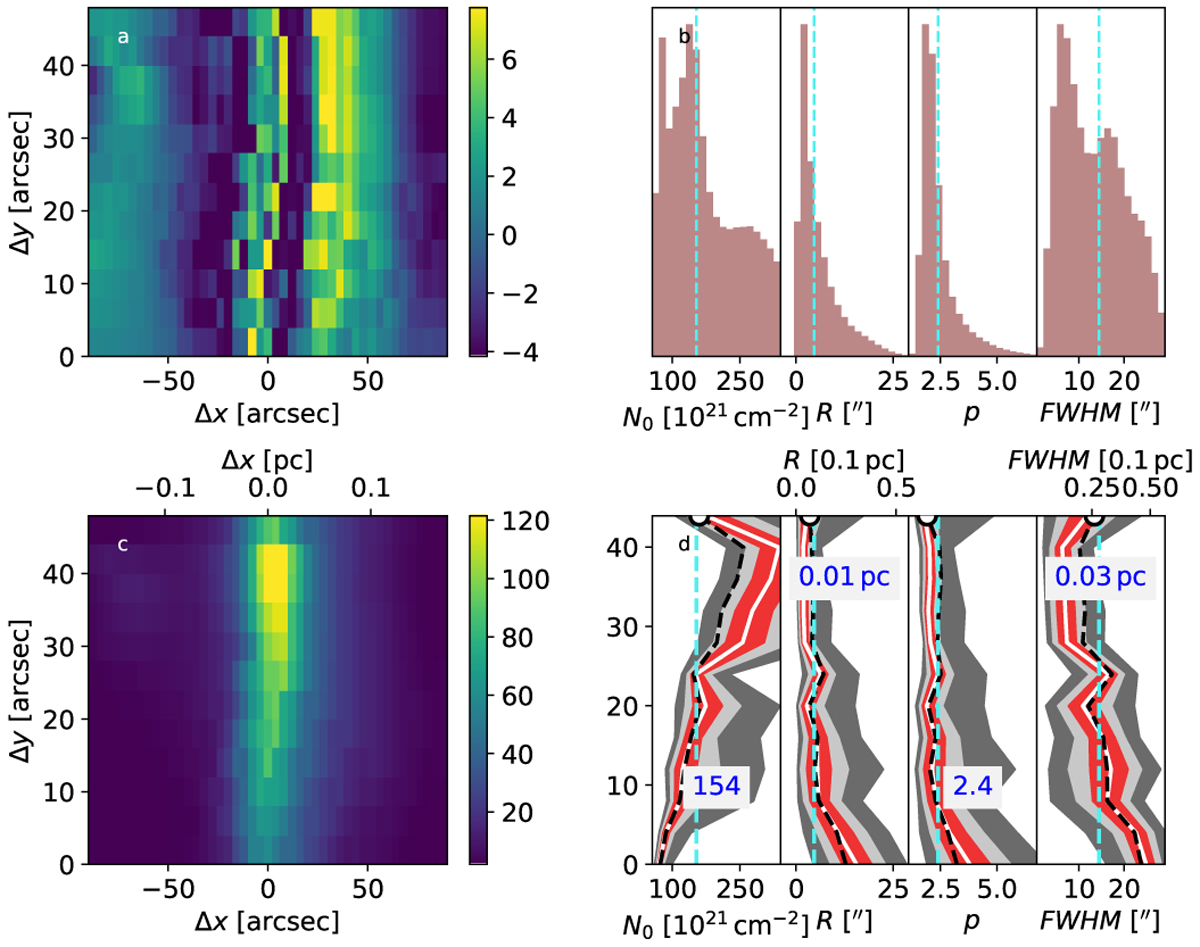
Plummer fits of OMC-3 filament segment A, using the HR column-density map (angular resolution 20″). Frame c shows the filament segment as a 2D image (the top row containing the median profile), frame a the fit residuals, frame d the parameter estimates along the filament, and frame b the parameter histograms (cf. description in Fig. 3). The column-density map has an angular resolution of 20″, and the fitted area is [−90″, +90″] in the cross-filament direction.
Current usage metrics show cumulative count of Article Views (full-text article views including HTML views, PDF and ePub downloads, according to the available data) and Abstracts Views on Vision4Press platform.
Data correspond to usage on the plateform after 2015. The current usage metrics is available 48-96 hours after online publication and is updated daily on week days.
Initial download of the metrics may take a while.