Fig. F.1
Download original image
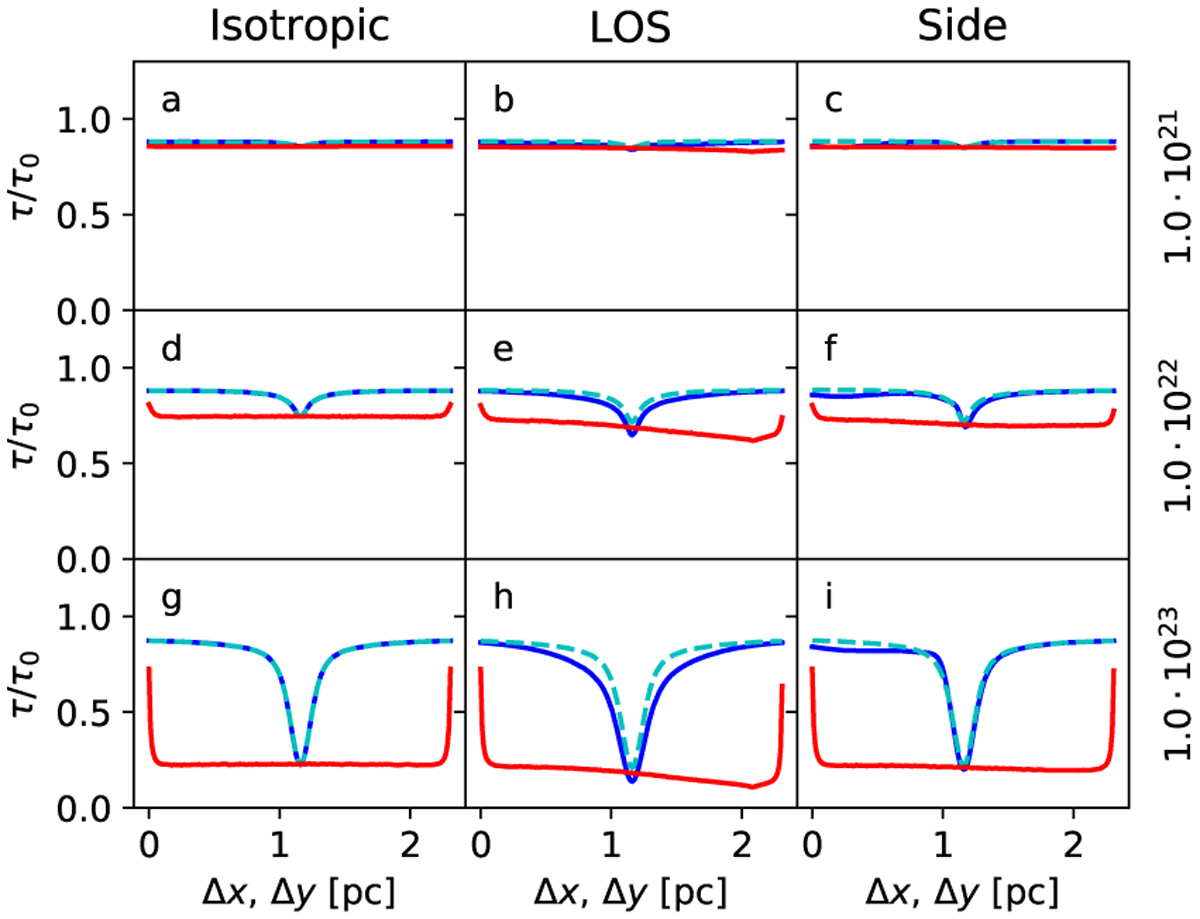
Ratio of estimated and true optical depths in case of simulated FIR observations of dust emission. The rows correspond different filament column densities. The columns correspond to different cases of the radiation field, with isotropic illumination or, alternatively, also including a point source at Δy = 2.09 pc and at a distance of 0.93 pc from the filament centre, either along the line of sight towards the filament or to the left of the filament (Δx=-0.93 pc). The ratios are plotted along the filament centre line (red curves, as a function of Δy) or across the filament at Δy = 1.4 pc (blue line) or Δy = 0.7 pc (dashed cyan line).
Current usage metrics show cumulative count of Article Views (full-text article views including HTML views, PDF and ePub downloads, according to the available data) and Abstracts Views on Vision4Press platform.
Data correspond to usage on the plateform after 2015. The current usage metrics is available 48-96 hours after online publication and is updated daily on week days.
Initial download of the metrics may take a while.