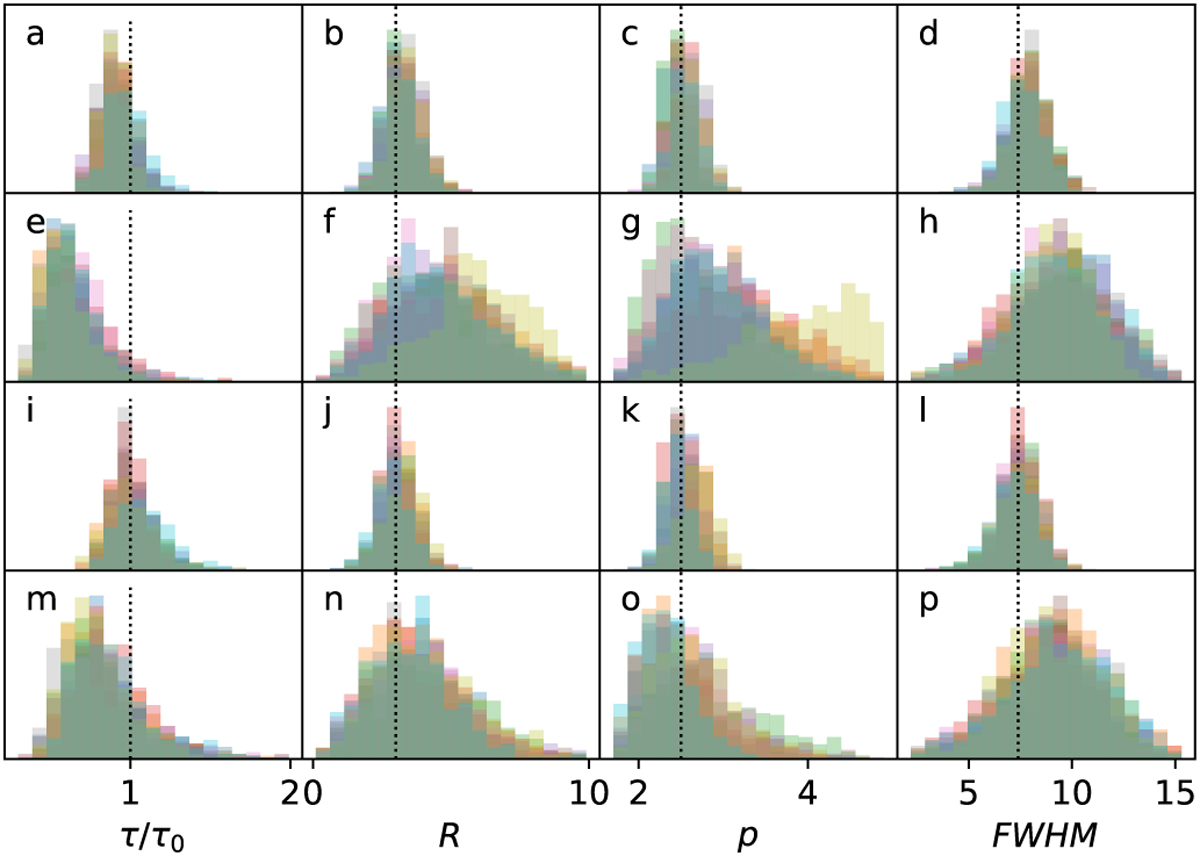
Fig. E.2
Download original image
Histograms of extracted filament parameters for simulated observations. The first three columns show the recovered central optical depth relative to the true value, τ/τ0, and the parameters R and p. The last column contains the FWHM values computed from the Plummer parameters. In frames (a)-(h), Ifg is estimated with Eq. (8), in frames (i)-(p) simply based on the minimum observed value. The noise values are 0.2 in frames (a)-(d) and (i)-(l) and 0.75 in frames (e)-(h) and m-p. In each frame, we overplot ten histograms. Each of the individual histograms corresponds one random error in the Iext value and contains 640 realisations of filament profiles with random observational errors.
Current usage metrics show cumulative count of Article Views (full-text article views including HTML views, PDF and ePub downloads, according to the available data) and Abstracts Views on Vision4Press platform.
Data correspond to usage on the plateform after 2015. The current usage metrics is available 48-96 hours after online publication and is updated daily on week days.
Initial download of the metrics may take a while.