Fig. E.1
Download original image
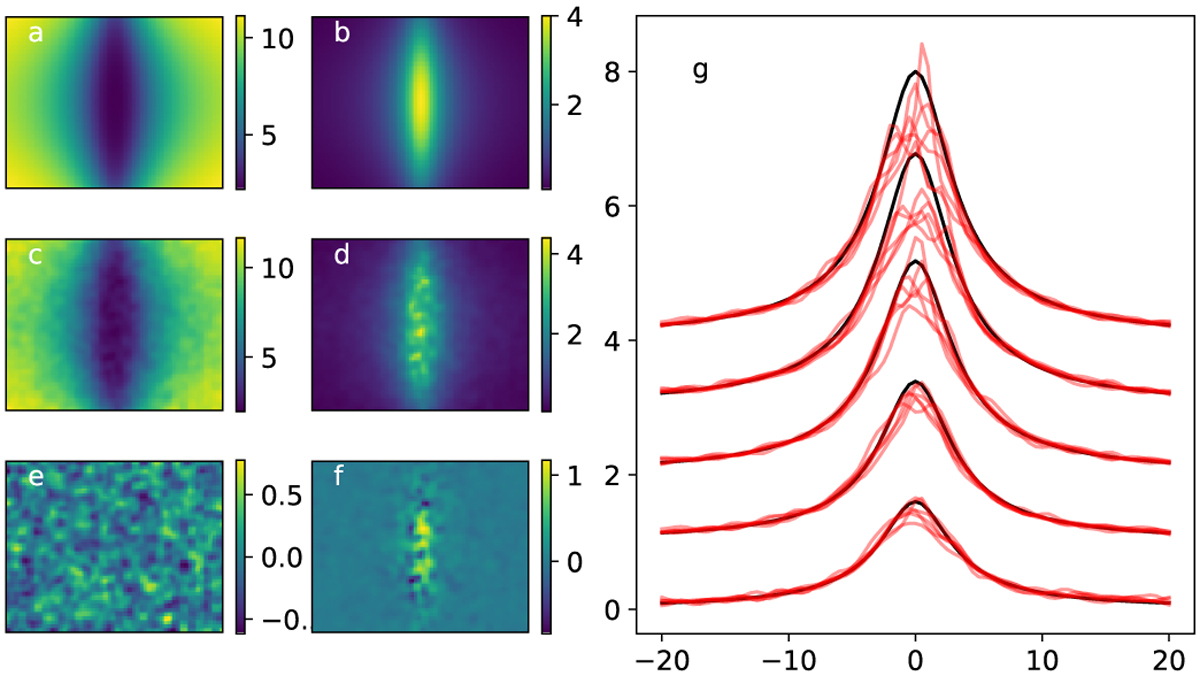
Example simulated MIR observations of a model filament. Frames (a) and (b) show the ideal absorption and the corresponding true optical depth image. Frames (c) and (d) are the corresponding noisy realisations, with noise 0.2 units for both surface brightness observations and for the determination of the level of Iext, and frames (e) and (f) show the differences between frames (a) and ()b and between frames (b) and (d). The black curves in frame g show examples of profiles, from the end of the filament (bottom curve) to the centre of the filament length (uppermost curve). The curves are offset along the y axis for better readability. For each ideal profile, there are ten realisations of the profiles derived from noisy observations.
Current usage metrics show cumulative count of Article Views (full-text article views including HTML views, PDF and ePub downloads, according to the available data) and Abstracts Views on Vision4Press platform.
Data correspond to usage on the plateform after 2015. The current usage metrics is available 48-96 hours after online publication and is updated daily on week days.
Initial download of the metrics may take a while.