Fig. 3
Download original image
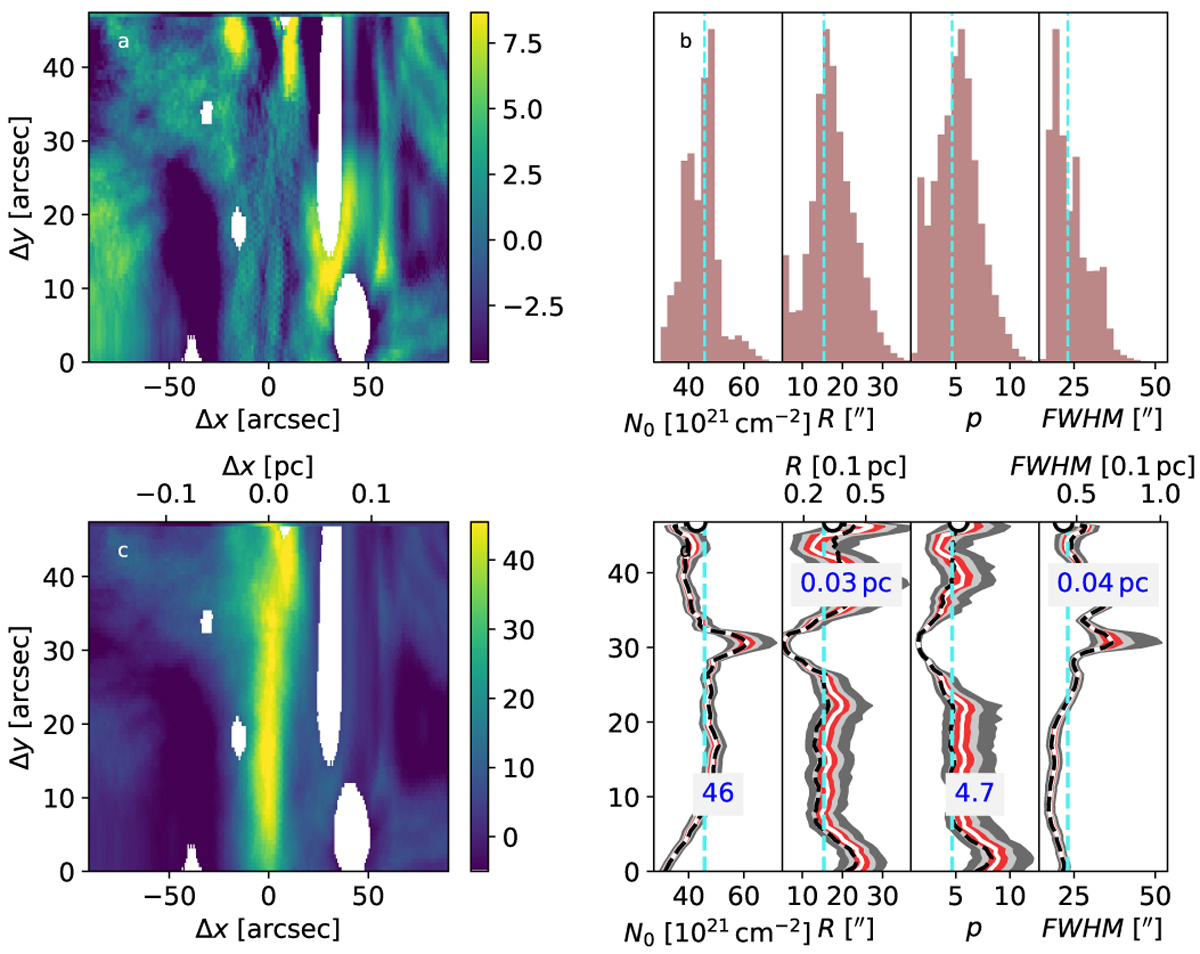
Results of the Plummer fits to OMC-3 filament segment A that was measured using MIR extinction. Frame c shows the filament column densities (units 1021 cm−2) as a 2D image, the filament running vertically in the plot. The top row contains the median profile. Frame a shows the fit residuals. Frame d shows the parameter estimates along the filament. The shaded regions correspond to different percentile ranges of MCMC samples: [1, 99]% in dark grey, [10, 90]% in light grey, and [25, 75]% in red. The MCMC median values are plotted as solid white curves. The values from separate χ2 minimisation are plotted with dashed black curves. The vertical dashed light green lines (frame b and frame d show the median of the parameter values in the individual least-squares fits, while the white half-circles at the top of frame d correspond to the fit to the median profile. Frame b shows histograms of the parameter distributions based on MCMC samples over all profiles.
Current usage metrics show cumulative count of Article Views (full-text article views including HTML views, PDF and ePub downloads, according to the available data) and Abstracts Views on Vision4Press platform.
Data correspond to usage on the plateform after 2015. The current usage metrics is available 48-96 hours after online publication and is updated daily on week days.
Initial download of the metrics may take a while.