Fig. A.1
Download original image
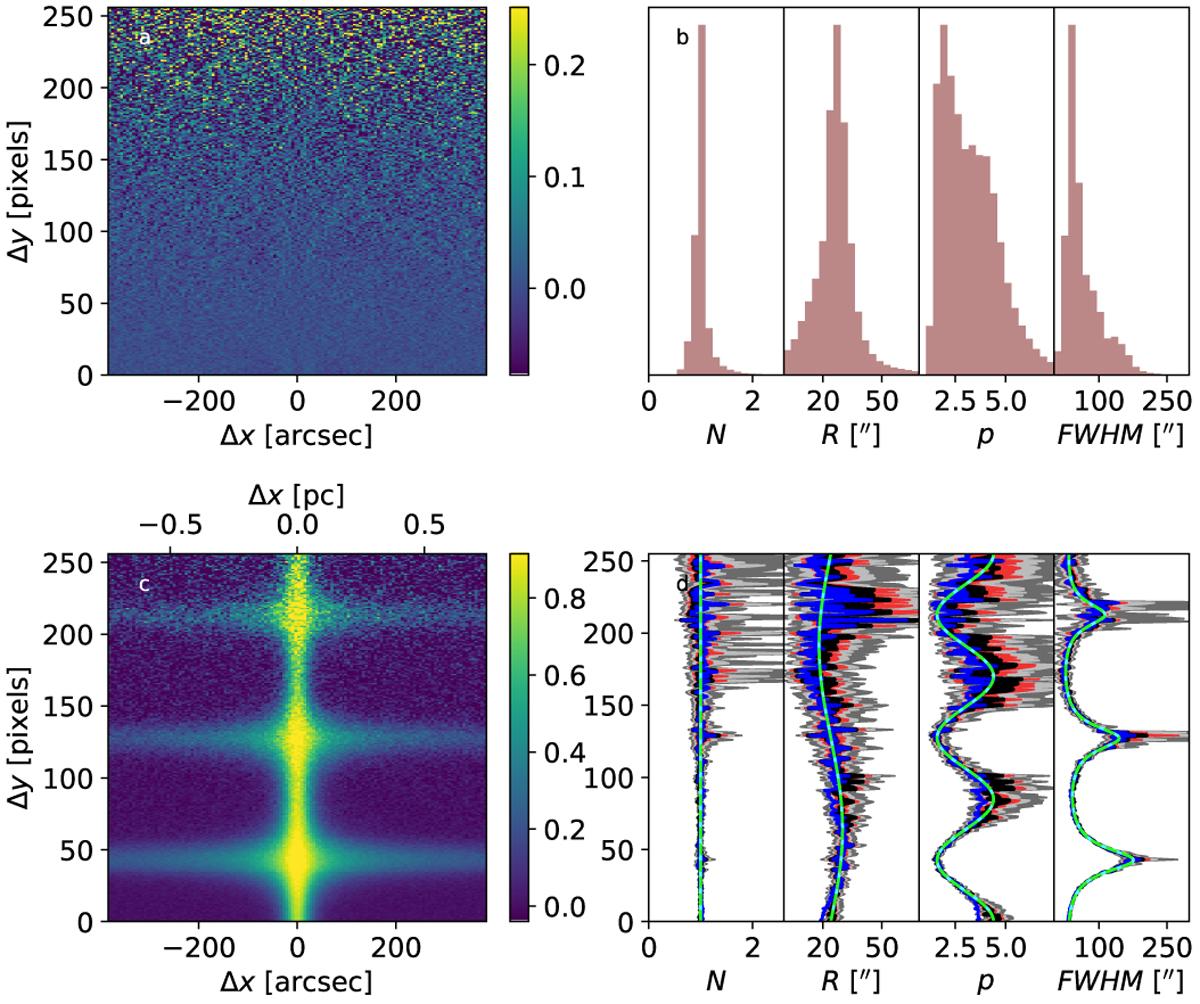
Fits of synthetic filament profiles. Frame (c) shows 256 generated profiles, where the noise relative to the filament peak increases logarithmically from 1% at the bottom (at Δy=0) to 20% at the top (at Δy = 255). The residuals of the least-squares fits are show in frame (a). Frame (d) shows the recovered parameter values, where the light-green lines correspond to the true input values, and the least-squares estimates are plotted in blue. For the MCMC calculations, the black lines show the mean of the MCMC samples and the red, light-grey, and dark-grey bands correspond to the [25, 75], [10,90], and [1, 99] percentile intervals, respectively. Frame (b) shows histograms corresponding to MCMC samples along the full length of the filament.
Current usage metrics show cumulative count of Article Views (full-text article views including HTML views, PDF and ePub downloads, according to the available data) and Abstracts Views on Vision4Press platform.
Data correspond to usage on the plateform after 2015. The current usage metrics is available 48-96 hours after online publication and is updated daily on week days.
Initial download of the metrics may take a while.