Fig. 18
Download original image
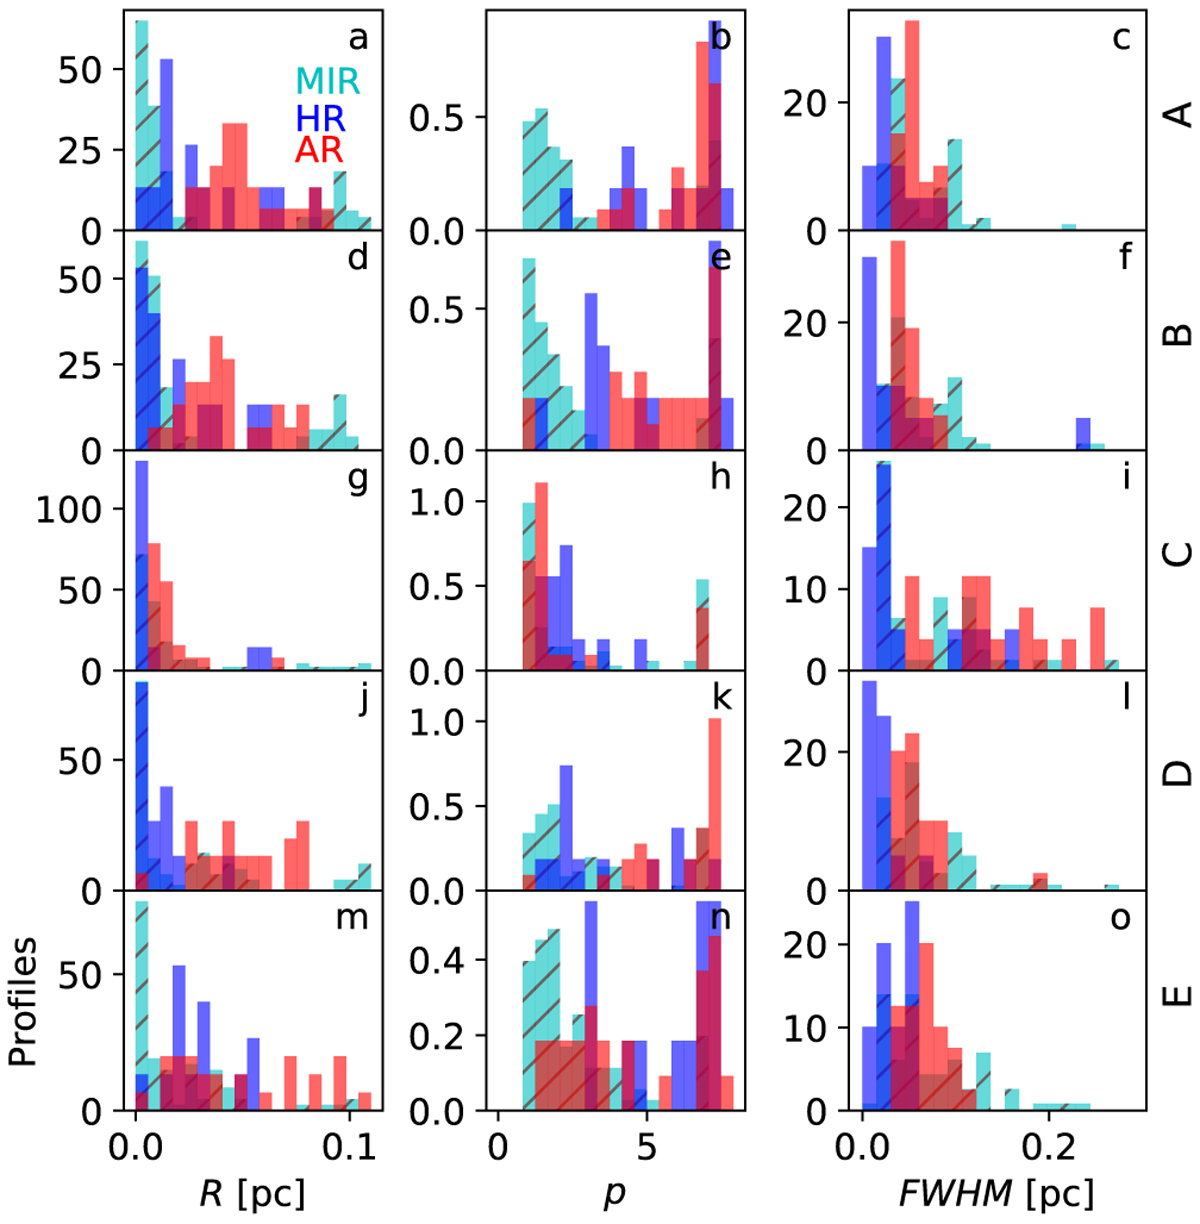
Alternative fits of the filament segment D. The histograms show the distributions of the R, p, and FWHM parameters that are estimated from the MIR, HR, and AR maps (cyan, blue, and red histograms, respectively). The rows are for alternative models of the profile function, where row Β corresponds to our default model. In the other fits, row A omits the shift of the filament centre, row C adds a second order term to the background, row D fits two-sided Plummer functions with linear background, and row Ε fits two-sided Plummer functions with a second order polynomial for the background.
Current usage metrics show cumulative count of Article Views (full-text article views including HTML views, PDF and ePub downloads, according to the available data) and Abstracts Views on Vision4Press platform.
Data correspond to usage on the plateform after 2015. The current usage metrics is available 48-96 hours after online publication and is updated daily on week days.
Initial download of the metrics may take a while.