Fig. 16
Download original image
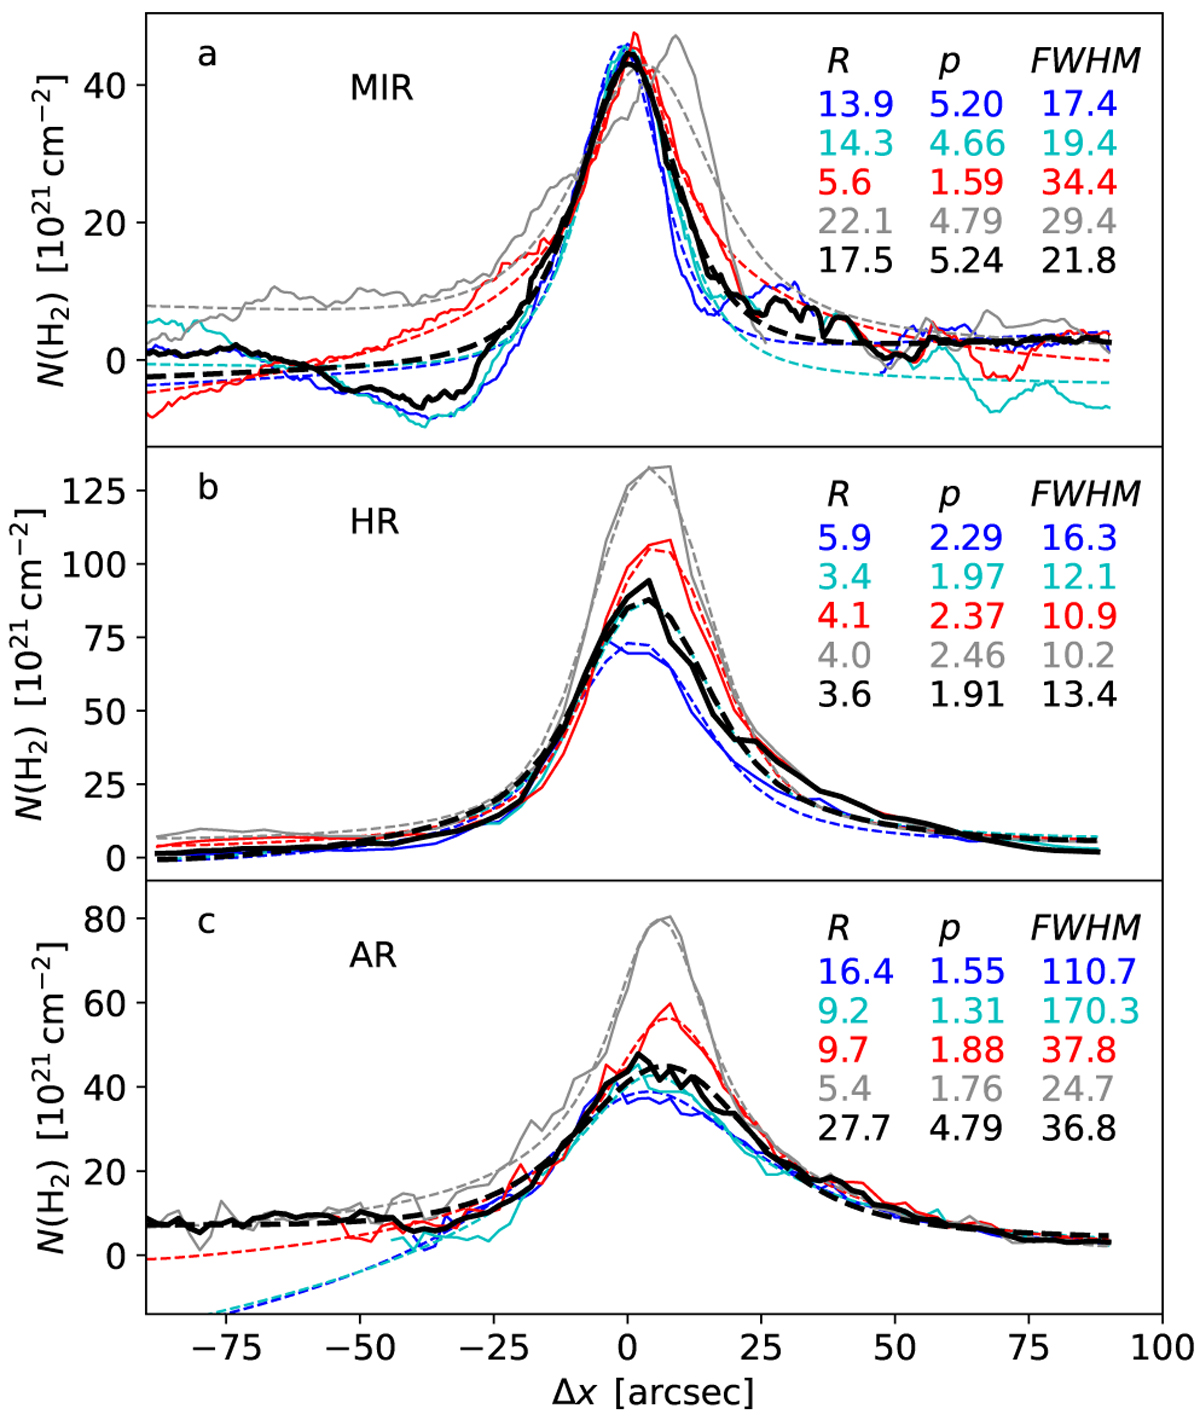
Plummer fits for selected cross-sections of the OMC-3 filament segment A. The three frames correspond to the MIR, HR, and AR column-density maps, respectively. Each frame shows individual profiles for the offsets Δy = 10, 20, 30, and 40 arcsec (cf. Figs. 3–5; blue, cyan, red, and grey lines, respectively) and the median profile (thick black lines). The best-fit Plummer profiles are plotted with dashed lines of the same colour, and R, p, and FWHM values of the fits are listed in the frames.
Current usage metrics show cumulative count of Article Views (full-text article views including HTML views, PDF and ePub downloads, according to the available data) and Abstracts Views on Vision4Press platform.
Data correspond to usage on the plateform after 2015. The current usage metrics is available 48-96 hours after online publication and is updated daily on week days.
Initial download of the metrics may take a while.