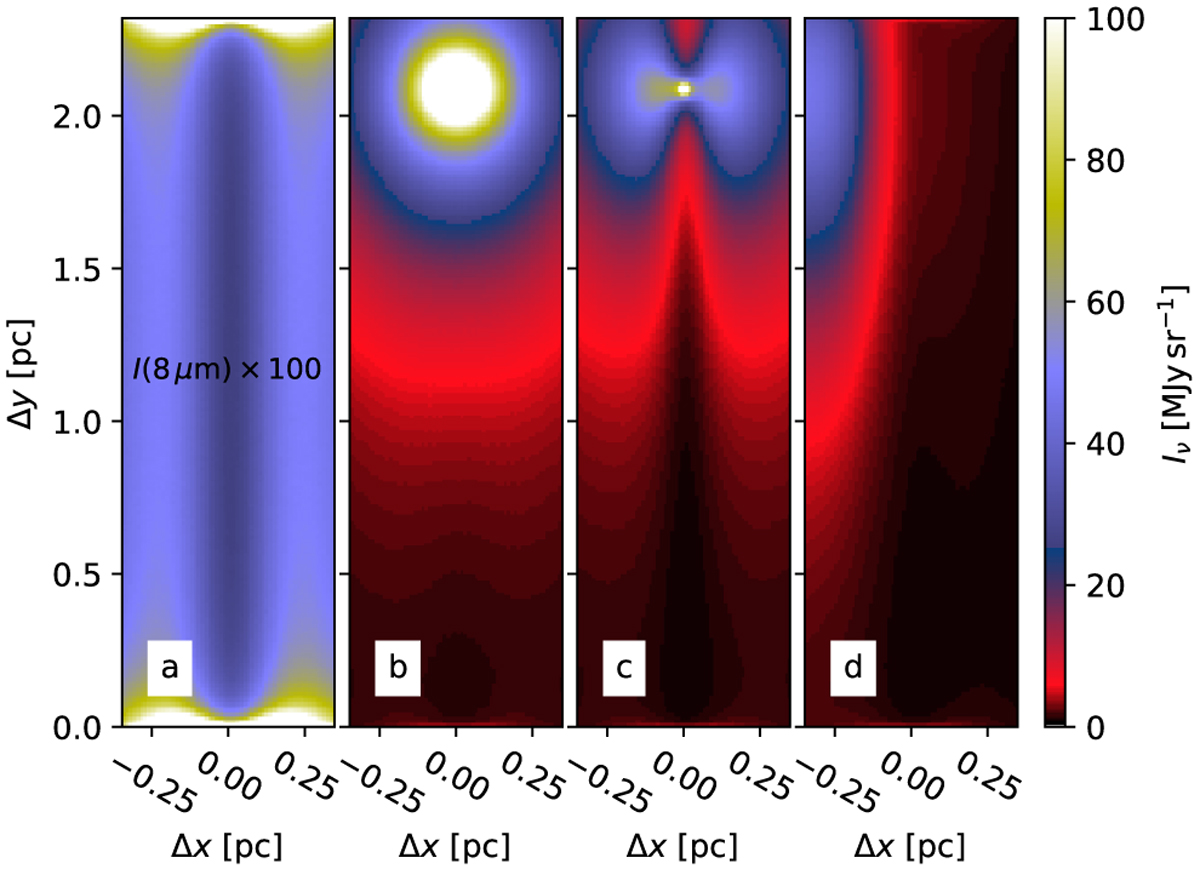
Fig. 14

Download original image
Maps of thermal dust emission Isbg calculated for the Ν (H2) = 3 × 1023 cm−2 filament model. Frame a corresponds to isotropic illumination with χ = 1, but the surface-brightness values are multiplied by 100 just for plotting (the same colour bar applies to all frames). The other frames include both the isotropic field and a point source located at Δy = 2.09 pc and at a distance of 0.93 pc in front, behind, or to the left of the filament centre axis (frames b, c, and d, respectively).
Current usage metrics show cumulative count of Article Views (full-text article views including HTML views, PDF and ePub downloads, according to the available data) and Abstracts Views on Vision4Press platform.
Data correspond to usage on the plateform after 2015. The current usage metrics is available 48-96 hours after online publication and is updated daily on week days.
Initial download of the metrics may take a while.


