Fig. 10
Download original image
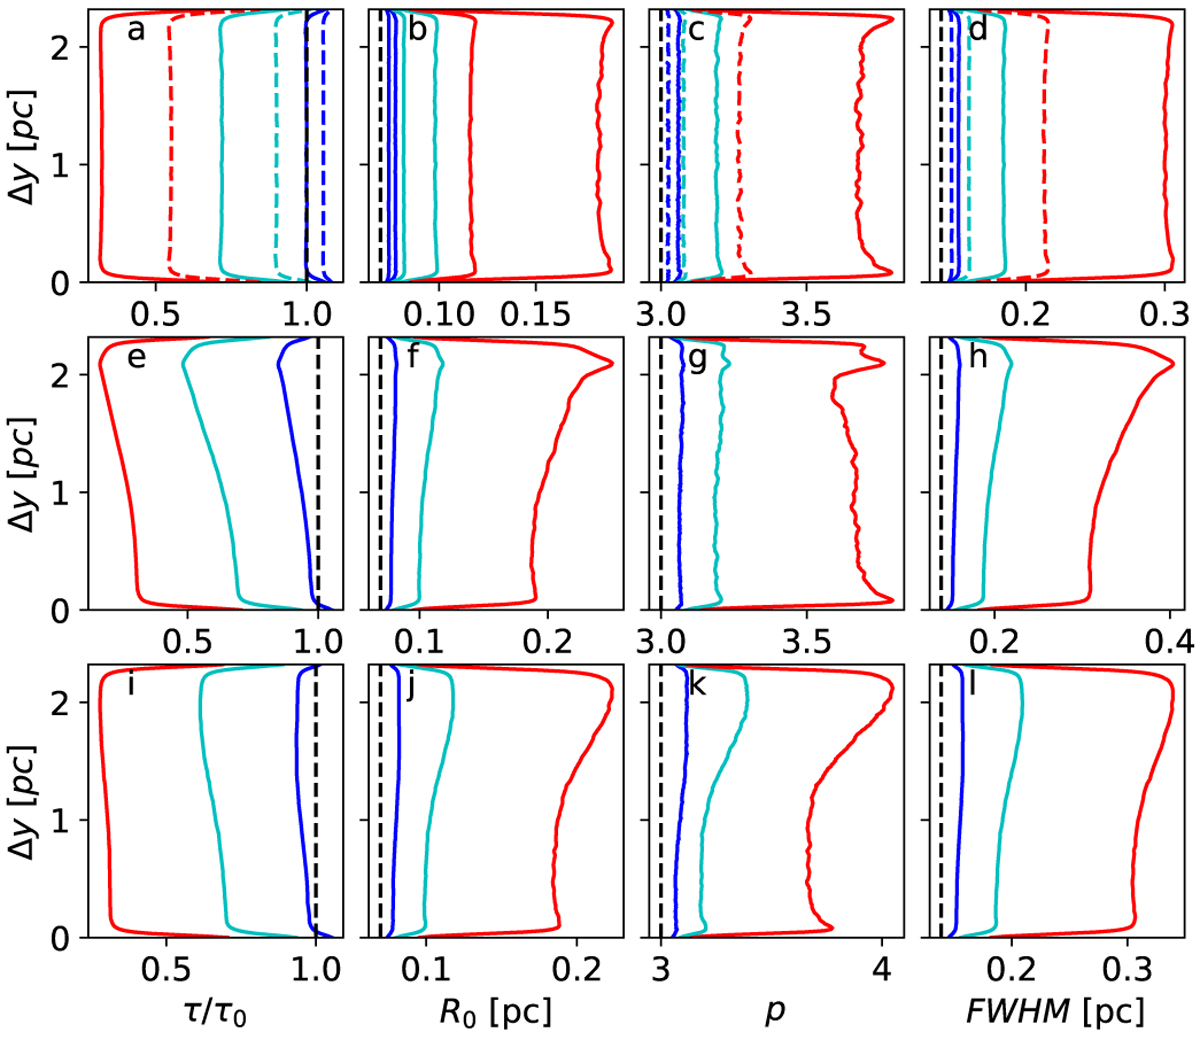
Variation in FIR-estimated parameters along model filaments in cases of: isotropic illumination (frames a–d); a 590 L⊙ point source at Δy = 2.09 pc and 0.93 pc behind the filament (frames e–h); and to one side of the filament (frames i–l). The plotted quantities are the ratio between the estimated and true FIR optical depths (τ/τ0), the Plummer parameters (R and p), and the filament FWHM calculated based on these. Each frame shows results for three model filaments with peak column densities N(H2) = 1022 cm−2 (blue lines), N(H2) = 3 × 10⁻²² cm−2 (cyan lines), and N(H2) = 1023 cm−2 (red lines). The dashed lines in frames a–d correspond to cases with a higher isotropic radiation field (χ = 10); all other cases include an isotropic field with χ = 1. True values are plotted with dashed black lines.
Current usage metrics show cumulative count of Article Views (full-text article views including HTML views, PDF and ePub downloads, according to the available data) and Abstracts Views on Vision4Press platform.
Data correspond to usage on the plateform after 2015. The current usage metrics is available 48-96 hours after online publication and is updated daily on week days.
Initial download of the metrics may take a while.