Fig. 1
Download original image
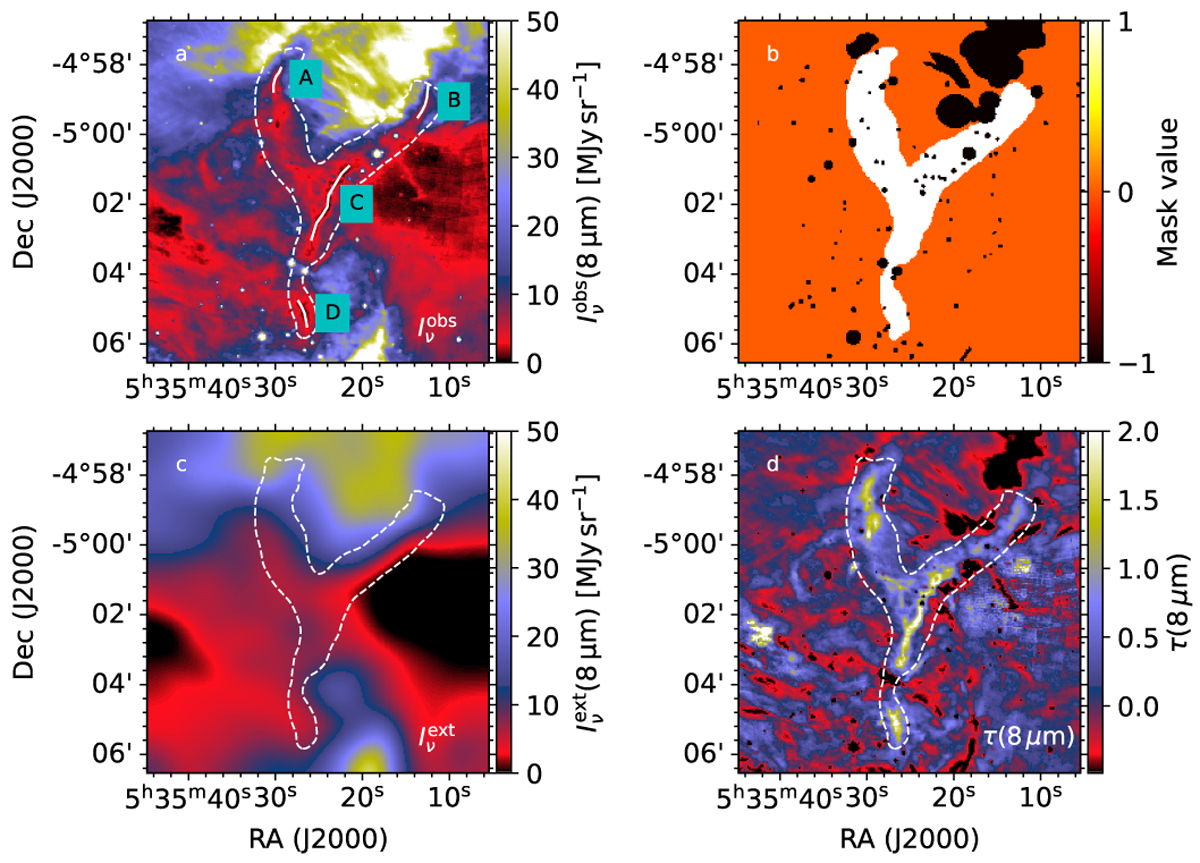
MIR observations of the OMC-3 field. Frame a shows the observed 8 μm surface brightness. Frame b shows the masks used, where the value 1 corresponds to the chosen filament region (shown with dashed contours in the other frames) and the value -1 corresponds to masked stars. Frame c shows the estimated extended emission, Iext, and frame d the resulting 8 μπι optical depth. Frame a also indicates the four filament fragments that were chosen for further analysis (solid white lines with labels A–D).
Current usage metrics show cumulative count of Article Views (full-text article views including HTML views, PDF and ePub downloads, according to the available data) and Abstracts Views on Vision4Press platform.
Data correspond to usage on the plateform after 2015. The current usage metrics is available 48-96 hours after online publication and is updated daily on week days.
Initial download of the metrics may take a while.