Fig. 9.
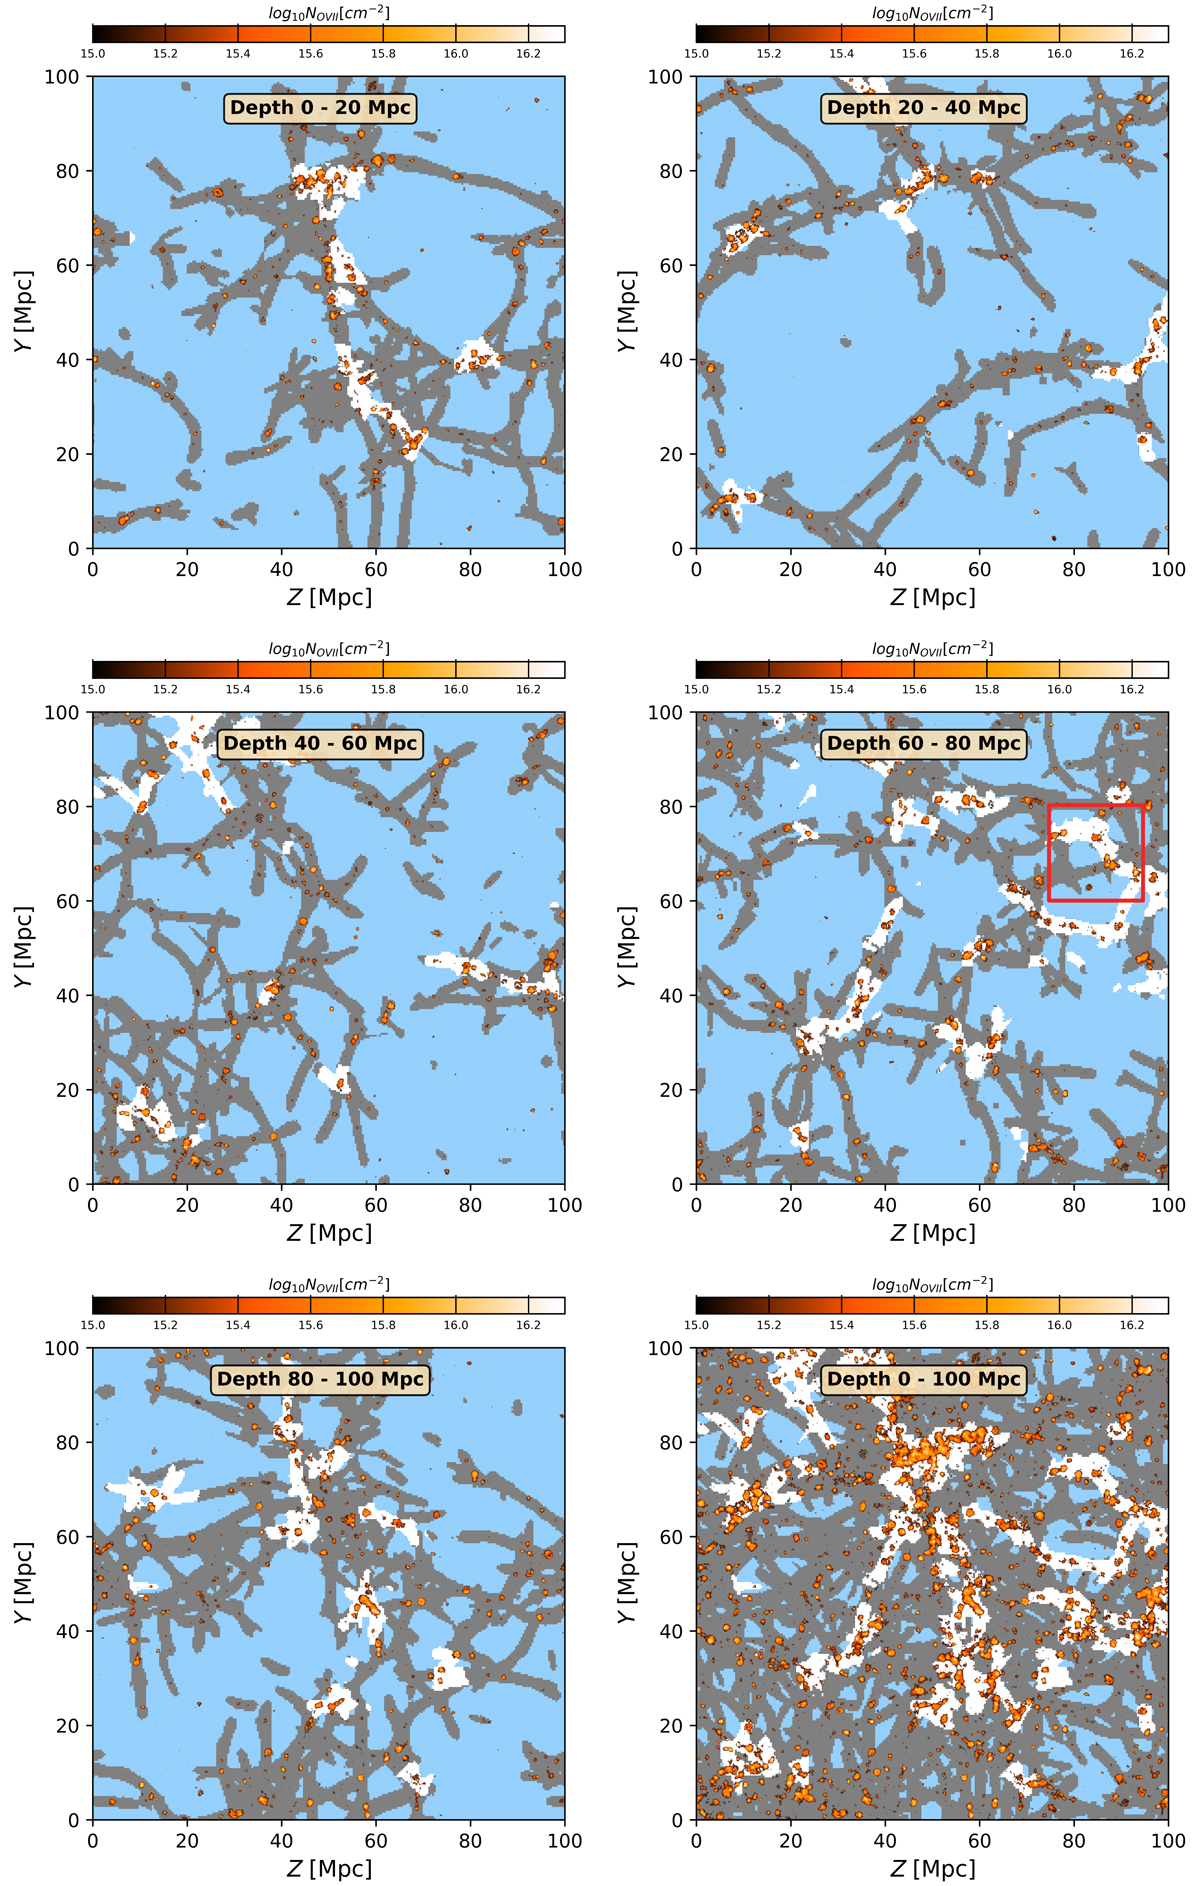
Download original image
O VII column densities (colour maps) above the approximate current and near-future X-ray detection limit of log NO VII(cm−2) = 15 through slices of 20 Mpc depth along the x-axis (the top and middle rows and the bottom-left panel), and the combination of all slices as a projection through the whole EAGLE box (100 Mpc, bottom-right panel). The region covered by high LD Bisous filaments is indicated in white, while the grey area shows the region covered by the lower density filaments. The red square in the middle-right panel corresponds to the region in Fig. 7.
Current usage metrics show cumulative count of Article Views (full-text article views including HTML views, PDF and ePub downloads, according to the available data) and Abstracts Views on Vision4Press platform.
Data correspond to usage on the plateform after 2015. The current usage metrics is available 48-96 hours after online publication and is updated daily on week days.
Initial download of the metrics may take a while.