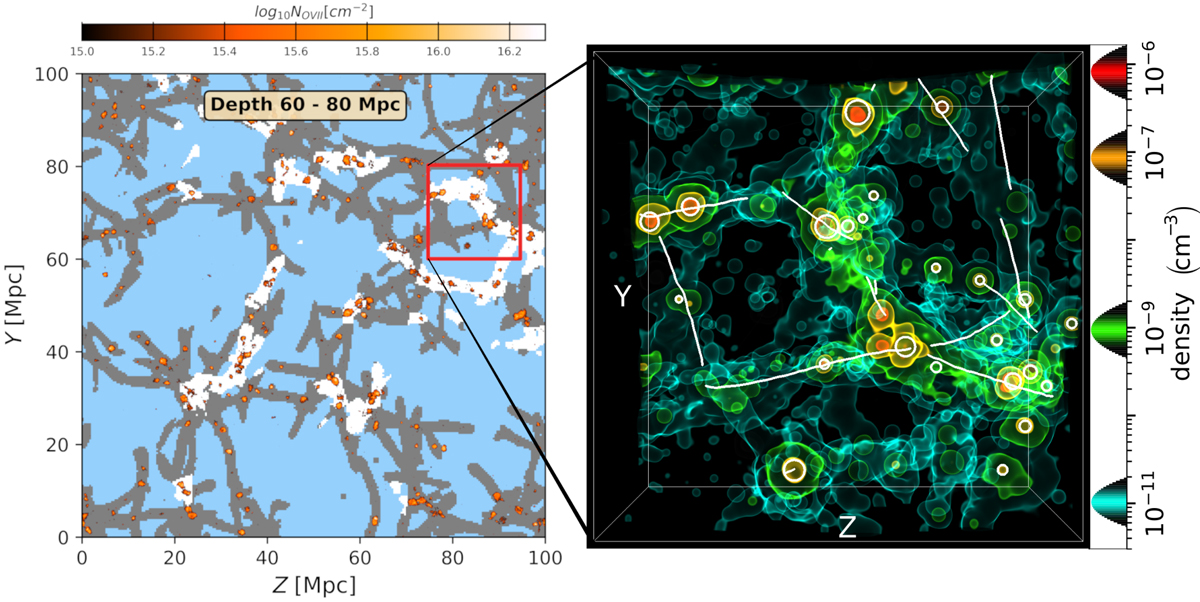
Fig. 7.
Download original image
Comparison between the two-dimensional column densities and the three-dimensional number densities of O VII. Left: column densities of O VII projected through a 20 Mpc deep slice along the x-axis. The colour scheme indicates the O VII column density with a lower limit at log NO VII(cm−2) = 15, while the Bisous filaments and high LD Bisous filaments are shown by grey and white areas, respectively. This image is the same as the middle-right panel of the column density maps in Fig. 9. The red square corresponds to the volume shown in the right-hand figure. Right: three-dimensional visualisation of the O VII distribution in a (20 Mpc)3 zoom-in box within the larger EAGLE volume. The coloured regions represent the O VII density contours at given values, as indicated on the right vertical axis. The green contour shows the spatial extent of O VII above the optimistic detection limit of nO VII = 10−9 cm−3 discussed in the text. The white lines show the Bisous filament spines, while the white circles indicate the volumes within R200 around the central galaxies of the FoF haloes. A three-dimensional visualisation is available as an online movie.
Current usage metrics show cumulative count of Article Views (full-text article views including HTML views, PDF and ePub downloads, according to the available data) and Abstracts Views on Vision4Press platform.
Data correspond to usage on the plateform after 2015. The current usage metrics is available 48-96 hours after online publication and is updated daily on week days.
Initial download of the metrics may take a while.