Fig. 6.
Download original image
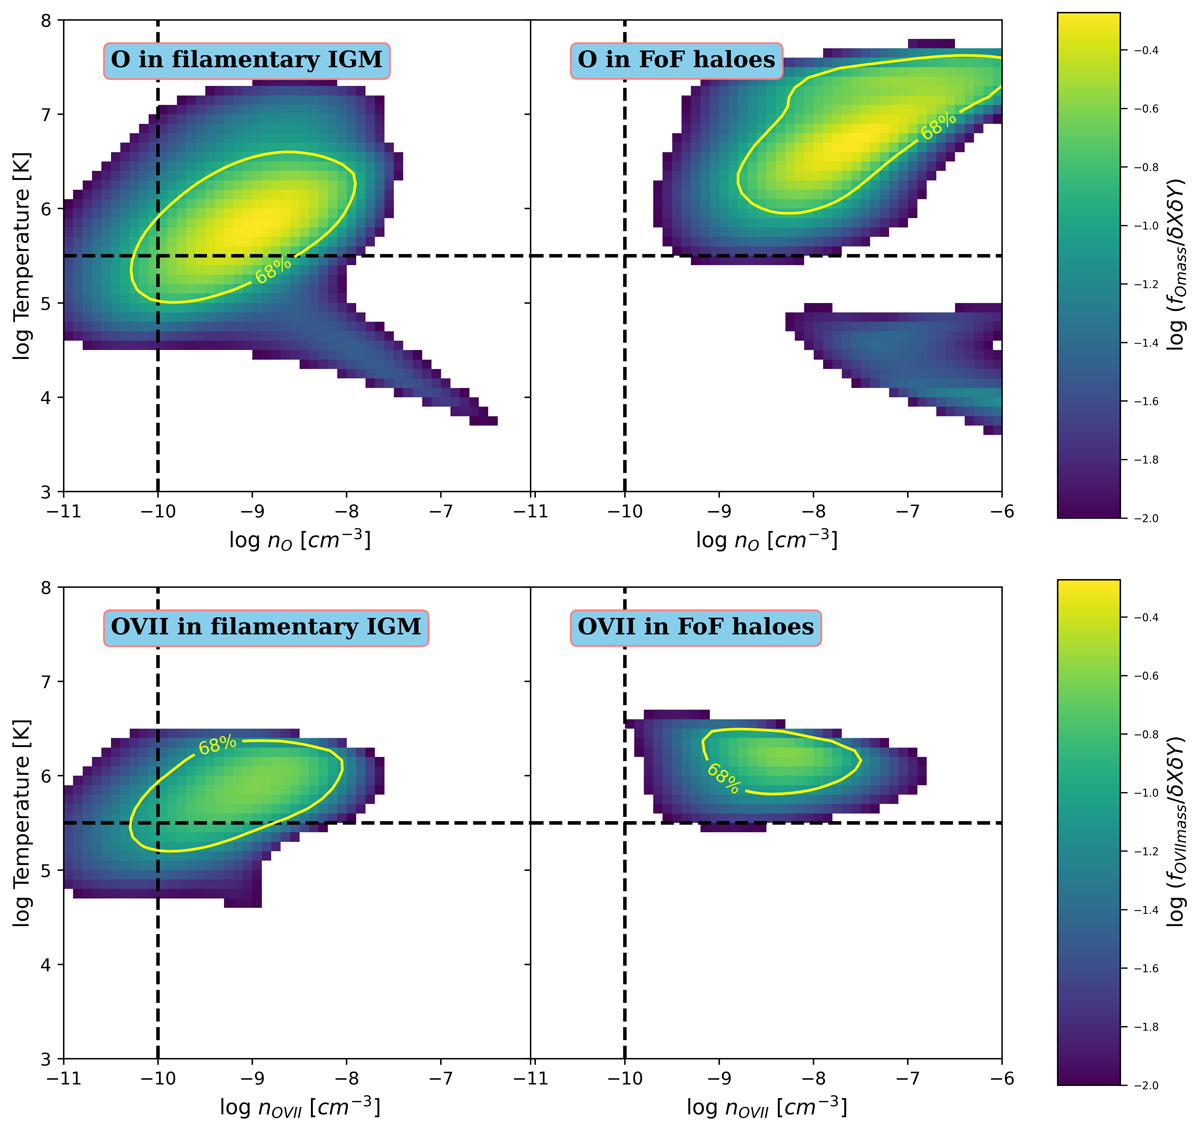
Distribution of oxygen (upper panel) and O VII (lower panel) mass as a function of number density and temperature. The left panels show the oxygen and O VII distributions in the IGM within Bisous filaments. Gas in FoF haloes is shown in the right panels, where we selected haloes located within Bisous filaments. The colour scales indicate the fractions of oxygen and O VII mass over the total oxygen mass in the same environment (divided by pixel area; values are shown down to 1%). The yellow circles mark the regions where 68% of the given mass is contained. The horizontal and vertical dashed lines mark the limit for the hot gas (log T(K) > 5.5) and the optimistic lower density limit for X-ray observations (given a 10 Mpc long path aligned with the line of sight), respectively.
Current usage metrics show cumulative count of Article Views (full-text article views including HTML views, PDF and ePub downloads, according to the available data) and Abstracts Views on Vision4Press platform.
Data correspond to usage on the plateform after 2015. The current usage metrics is available 48-96 hours after online publication and is updated daily on week days.
Initial download of the metrics may take a while.