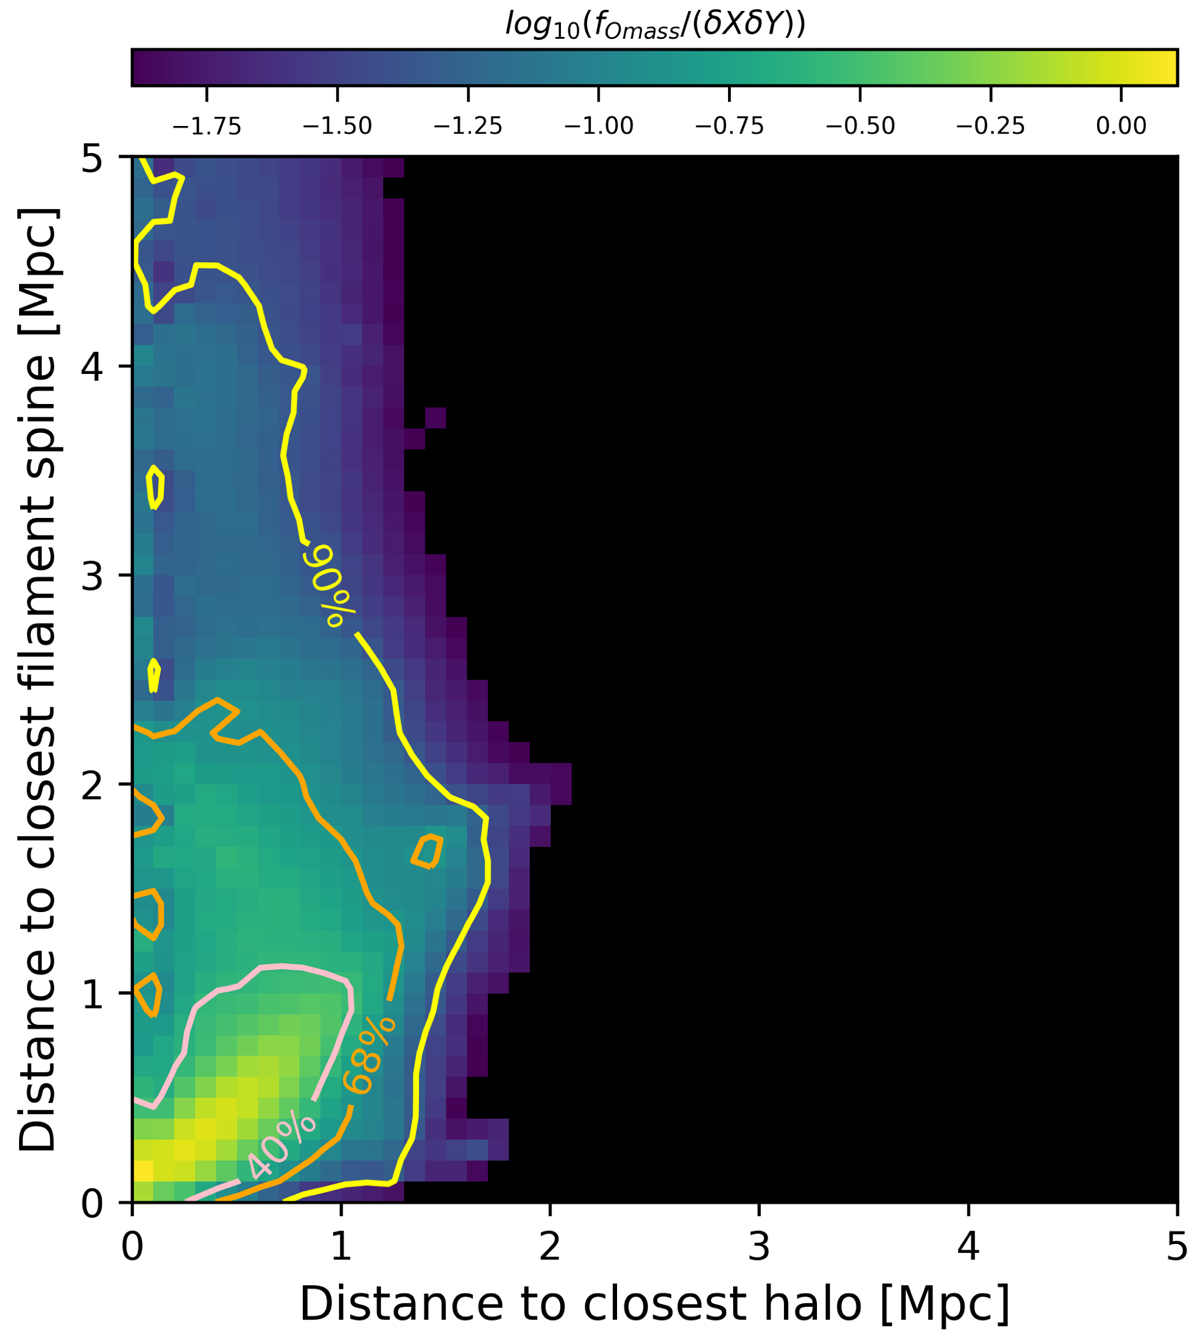
Fig. 5.
Download original image
Oxygen mass fraction towards halo centres and filament spines. Each simulated particle was positioned within one pixel in the diagram based on the distance to its closest halo centre and filament spine. Subsequently, the oxygen mass contained in the particles was co-added within each pixel and divided by the pixel size. Finally, the value in each pixel was normalised with the highest value in the diagram. The colour map shows values down to 1% of the peak value. The pink, orange, and yellow contour lines enclose 40%, 68%, and 90% of the oxygen mass, respectively.
Current usage metrics show cumulative count of Article Views (full-text article views including HTML views, PDF and ePub downloads, according to the available data) and Abstracts Views on Vision4Press platform.
Data correspond to usage on the plateform after 2015. The current usage metrics is available 48-96 hours after online publication and is updated daily on week days.
Initial download of the metrics may take a while.