Open Access
Fig. 10.
Download original image
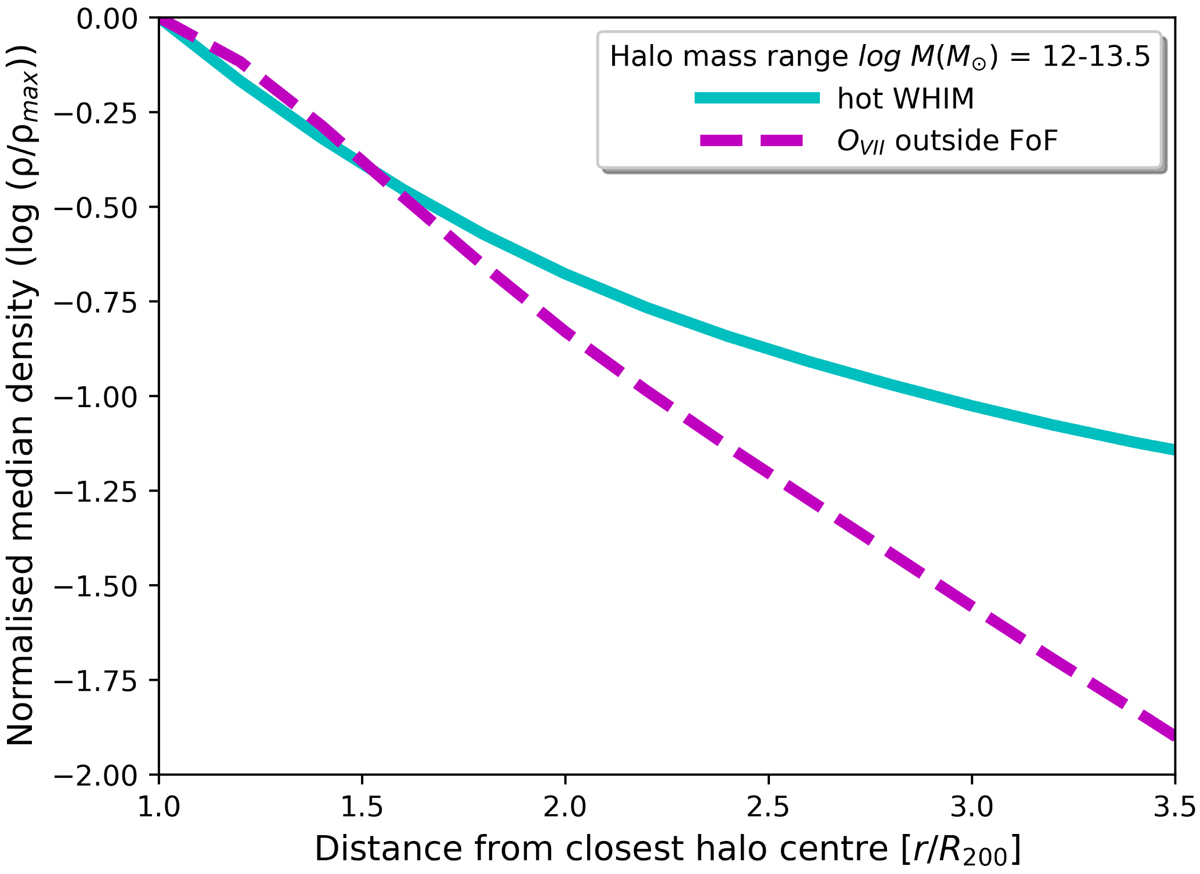
Normalised density distribution of the hot WHIM (turquoise line) and O VII (dashed purple line) as a function of distance from the closest halo centre, in units of virial radius, R200. As in Fig. 1, haloes were selected within the range of log M200(M⊙) = 12 − 13.5.
Current usage metrics show cumulative count of Article Views (full-text article views including HTML views, PDF and ePub downloads, according to the available data) and Abstracts Views on Vision4Press platform.
Data correspond to usage on the plateform after 2015. The current usage metrics is available 48-96 hours after online publication and is updated daily on week days.
Initial download of the metrics may take a while.