Fig. 7.
Download original image
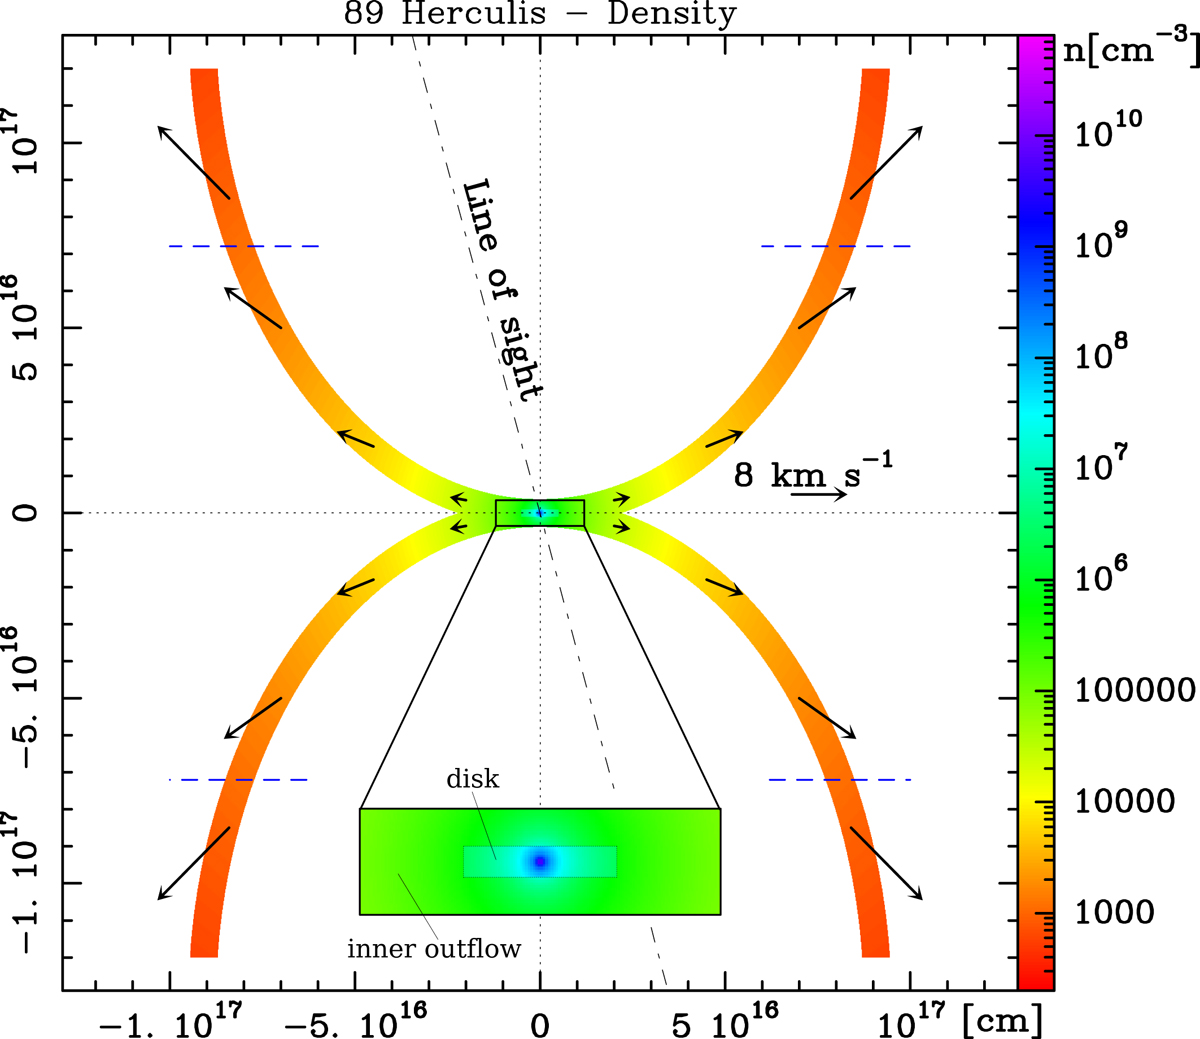
Structure and distribution of the density of our best-fit model for the disk and outflow of 89 Her. The lower inset shows a zoom into the innermost region of the outflow together with the rotating disk, with density values of ∼106 and ≥107 cm−3, respectively. The rest of the outflow presents density values ≤105 cm−3. The expansion velocity is represented with arrows. The four horizontal blue dashed lines mark the former extent of the nebula in our previous model (see Gallardo Cava et al. 2021).
Current usage metrics show cumulative count of Article Views (full-text article views including HTML views, PDF and ePub downloads, according to the available data) and Abstracts Views on Vision4Press platform.
Data correspond to usage on the plateform after 2015. The current usage metrics is available 48-96 hours after online publication and is updated daily on week days.
Initial download of the metrics may take a while.