Open Access
Fig. 5.
Download original image
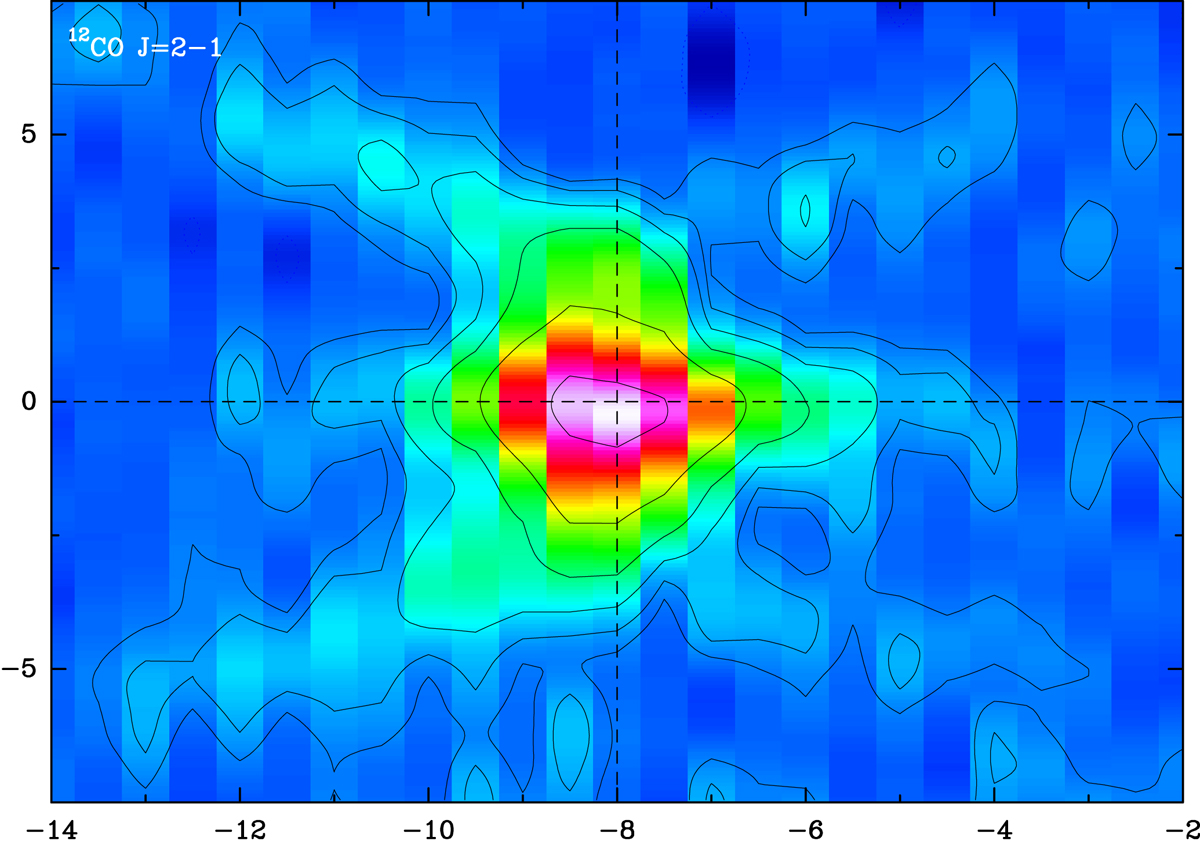
Position–velocity diagram from our merged maps of 12CO J = 2 − 1 in 89 Her along the direction PA = 150°, corresponding to the nebula equator. The contours are: −40, 40, 80, 160, 320, 640, and 1280 mJy beam−1, with a maximum emission peak of 1.45 mJy beam−1. The dashed lines show the central position and systemic velocity.
Current usage metrics show cumulative count of Article Views (full-text article views including HTML views, PDF and ePub downloads, according to the available data) and Abstracts Views on Vision4Press platform.
Data correspond to usage on the plateform after 2015. The current usage metrics is available 48-96 hours after online publication and is updated daily on week days.
Initial download of the metrics may take a while.