Open Access
Fig. B.2.
Download original image
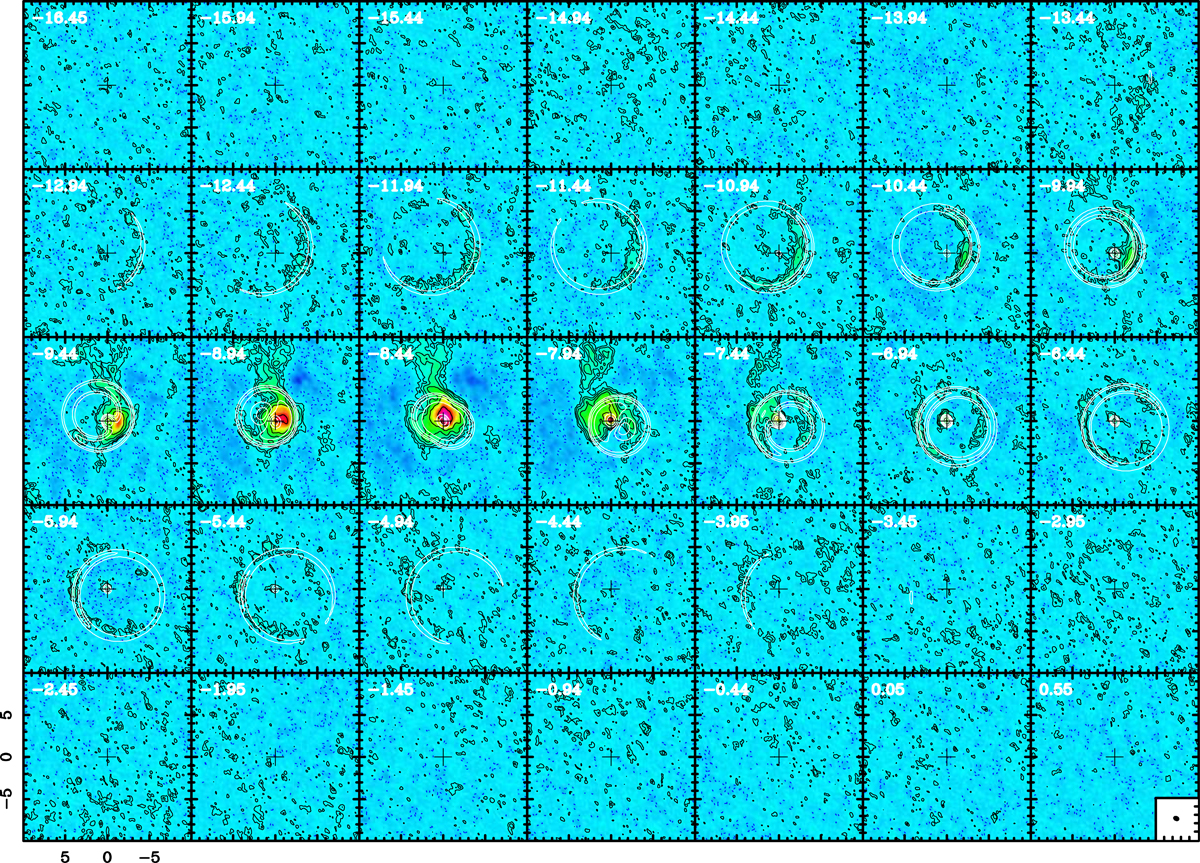
Synthetic maps predicted by the model of the 13CO J = 2 − 1 line emission for the nebula around 89 Her, which is shown in white. The maps are superimposed on the observational ones. The contours for both the observational data and model are: −5 (observational data only), 5, 10, 20, 40, 80, and 160 mJy beam−1.
Current usage metrics show cumulative count of Article Views (full-text article views including HTML views, PDF and ePub downloads, according to the available data) and Abstracts Views on Vision4Press platform.
Data correspond to usage on the plateform after 2015. The current usage metrics is available 48-96 hours after online publication and is updated daily on week days.
Initial download of the metrics may take a while.