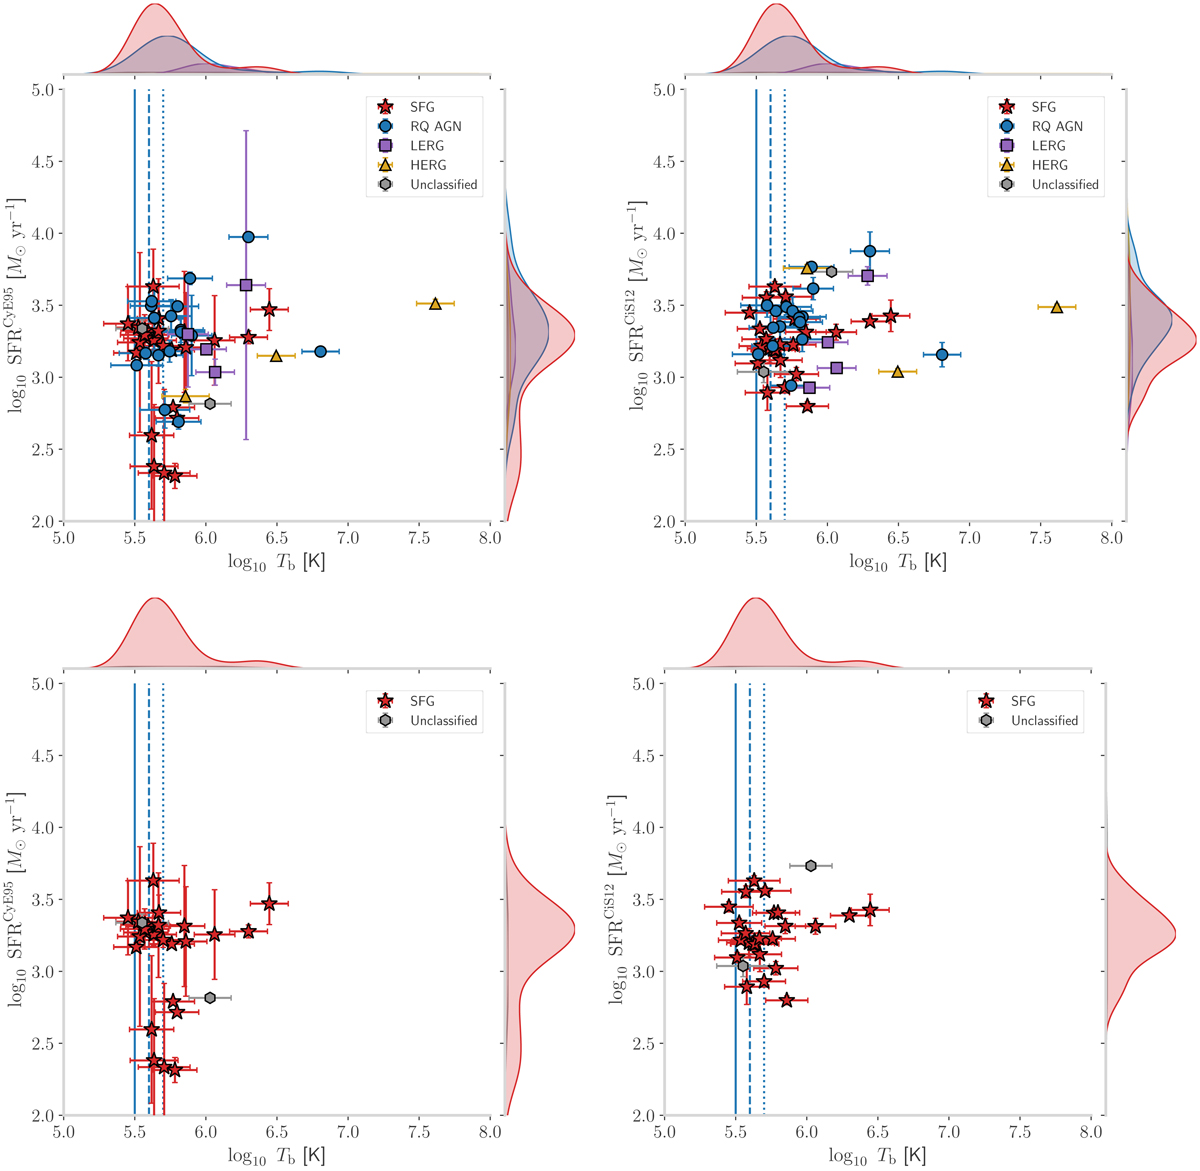
Fig. 7.
Download original image
Star formation rate versus brightness temperature of the 51 HLIRGs detected in LDHD image at the 5σrms level. Top: full sample, coloured according to the classification of Best et al. (in prep.). Bottom: showing only SFGs and unclassified sources; 27 in total. Left: SFR as estimated from the CyE95 model. Right: SFR estimated from the CiS12 model. Marginalised distributions over the SFR and brightness temperature are shown on top and to the right of each panel. The colours correspond to the colours of the points.
Current usage metrics show cumulative count of Article Views (full-text article views including HTML views, PDF and ePub downloads, according to the available data) and Abstracts Views on Vision4Press platform.
Data correspond to usage on the plateform after 2015. The current usage metrics is available 48-96 hours after online publication and is updated daily on week days.
Initial download of the metrics may take a while.