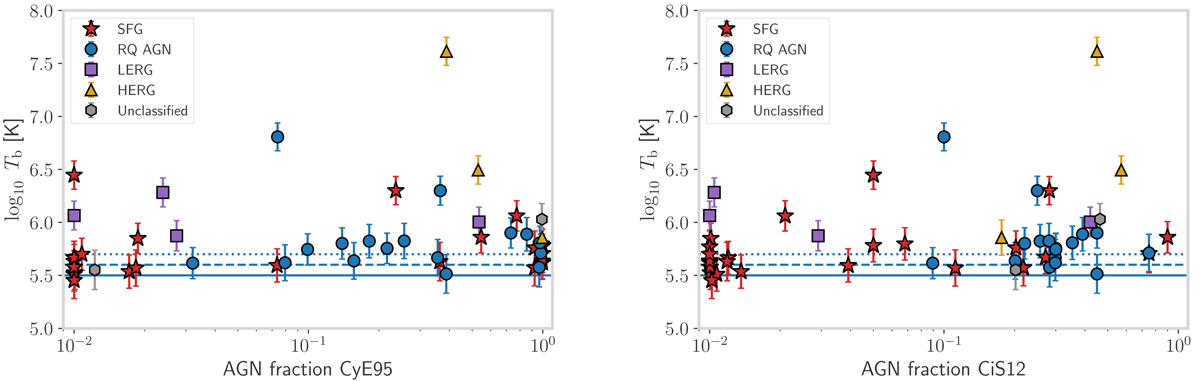
Fig. 6.
Download original image
Brightness temperature versus AGN fraction. Left: AGN fraction derived from the CyE95 fit. Right: AGN fraction derived from the CiS12 fit. The solid, dashed, and dotted blue lines indicate the maximum brightness temperature from starbursts for a synchrotron spectral index α of −0.7, −0.8, and −0.9, respectively, as per Condon et al. (1991). Points above these lines cannot be driven by pure star formation. Estimates with fAGN < 0.01 were offset by 0.01 for visual clarity. Points are coloured by the classification of Best et al. (in prep.).
Current usage metrics show cumulative count of Article Views (full-text article views including HTML views, PDF and ePub downloads, according to the available data) and Abstracts Views on Vision4Press platform.
Data correspond to usage on the plateform after 2015. The current usage metrics is available 48-96 hours after online publication and is updated daily on week days.
Initial download of the metrics may take a while.