Fig. 5.
Download original image
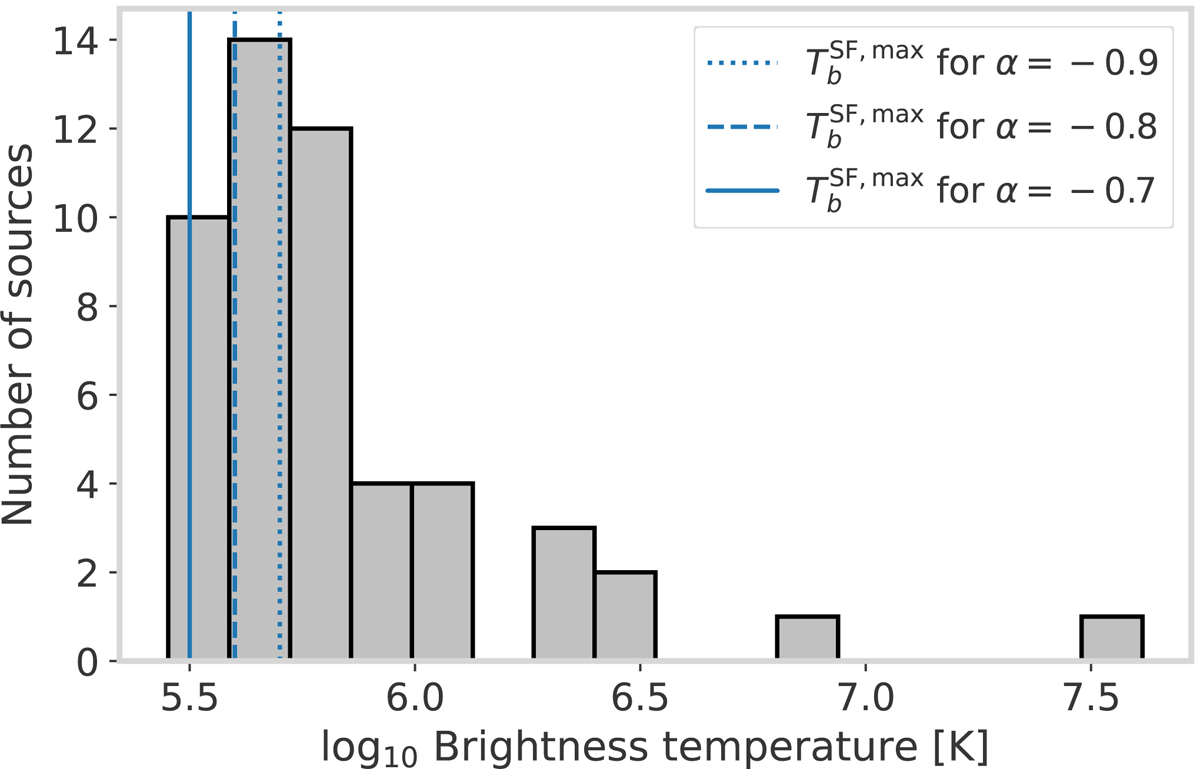
Distribution of brightness temperatures in the LoTSS-Deep-HD detected sources. The solid, dashed, and dotted blue lines indicate the maximum brightness temperature from starbursts for a synchrotron spectral index α of −0.7, −0.8, and −0.9, respectively, as per Condon et al. (1991). Values to the right of this line cannot be driven by pure star formation.
Current usage metrics show cumulative count of Article Views (full-text article views including HTML views, PDF and ePub downloads, according to the available data) and Abstracts Views on Vision4Press platform.
Data correspond to usage on the plateform after 2015. The current usage metrics is available 48-96 hours after online publication and is updated daily on week days.
Initial download of the metrics may take a while.