Fig. 4.
Download original image
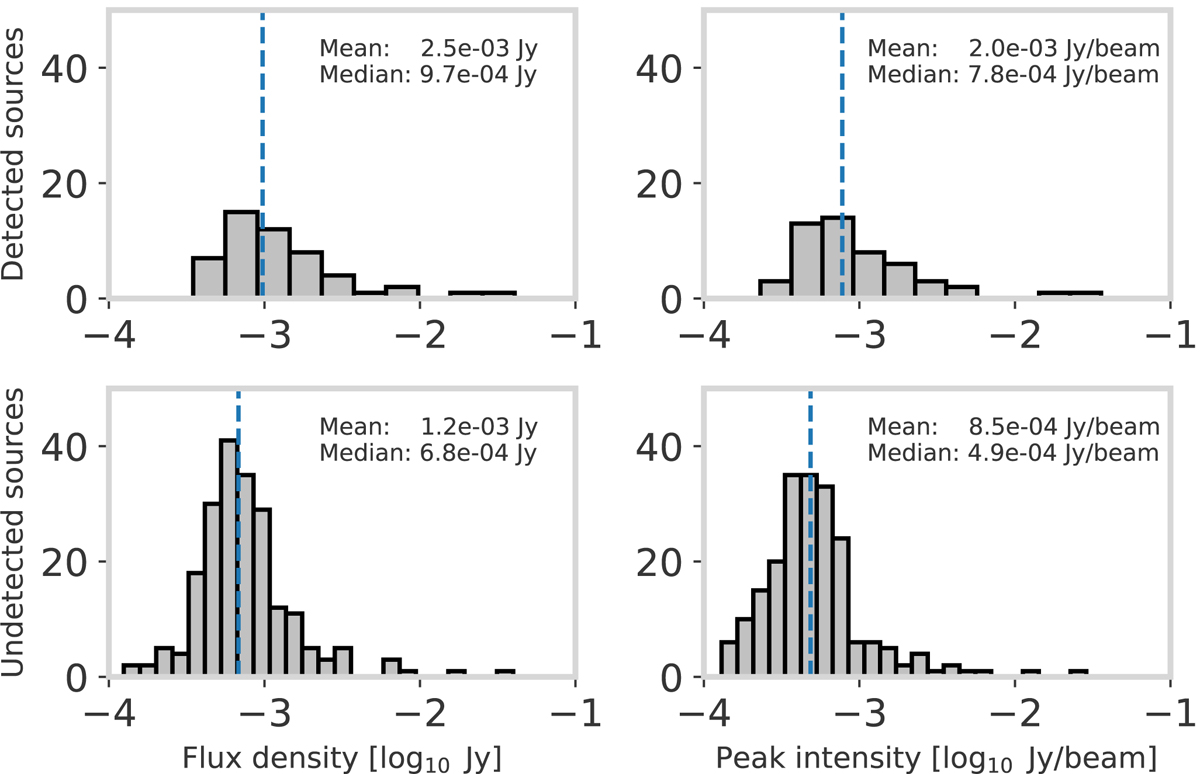
LoTSS-Deep 6″ flux density (left) and peak intensity (right) distributions for LoTSS-Deep-HD detected (top) and undetected (bottom) sources. The blue dashed line indicates the median of each distribution. LoTSS-Deep-HD-undetected sources have systematically lower values that are close to or below the 5σ surface brightness limit of the high-resolution image.
Current usage metrics show cumulative count of Article Views (full-text article views including HTML views, PDF and ePub downloads, according to the available data) and Abstracts Views on Vision4Press platform.
Data correspond to usage on the plateform after 2015. The current usage metrics is available 48-96 hours after online publication and is updated daily on week days.
Initial download of the metrics may take a while.